
National Income And Price Determination
Subject: Economics
Grade: High school
Topic: Ap College Macroeconomics
Please LOG IN to download the presentation. Access is available to registered users only.
View More Content


Introduction to National Income
– Economy as an interconnected system
– Defining National Income
– Total income earned by a nation’s factors of production
– Components: Wages, Rent, Interest, Profit
– Breakdown: Wages for labor, Rent for land, Interest on capital, Profit for entrepreneurship
– Role in economic analysis
|
This slide introduces the concept of National Income, which is a measure of the monetary value of all the finished goods and services produced within a country’s borders in a specific time period. It’s important to convey to students that understanding National Income gives us a snapshot of the economy’s overall health. The components of National Income include wages paid to labor, rent earned by land, interest received by capital, and profits accrued to entrepreneurs. These components are crucial for understanding how income is distributed in an economy. Discuss how each component contributes to the total National Income and its significance in macroeconomic analysis. Encourage students to think about how changes in these components might affect the overall economy.
Measuring National Income
– GDP vs GNP
– GDP: value of goods/services produced within a country. GNP: includes international income.
– NNP and NI
– NNP: GNP minus depreciation. NI: total income earned by a nation’s residents.
– Income Approach
– Calculates NI by summing all incomes: wages, rents, interest, and profits.
– Expenditure Approach
– Totals spending on goods/services: consumer, government, investment, and net exports.
|
This slide introduces the key concepts for measuring a nation’s economic performance. GDP and GNP are both measures of economic output, but while GDP is confined to the geographical borders of a country, GNP includes the income from its residents’ international investments. NNP accounts for the wear and tear on the nation’s stock of capital, providing a clearer picture of economic status. National Income represents the total income of all residents. The Income Approach and the Expenditure Approach are two sides of the same coin, one looking at income generated, the other at money spent. Understanding these concepts is crucial for students to grasp the complexities of national income and price determination in macroeconomics.
Circular Flow of Income in Macroeconomics
– Households and firms interaction
– Households provide labor, firms pay wages and produce goods/services.
– Tracking money, goods, services flow
– Money exchanges for goods/services, creating a flow in the economy.
– Understanding leakages in the economy
– Leakages are savings, taxes, imports that remove money from the cycle.
– Identifying injections into the economy
– Injections are investments, government spending, exports adding money.
|
This slide introduces the concept of the circular flow of income, a fundamental model in macroeconomics that illustrates how money moves through the economy. It’s crucial to explain the roles of households and firms: households offer factors of production like labor, and in return, receive income which they use to purchase goods and services from firms. The flow of money, goods, and services between these two entities creates a cycle that is the backbone of economic activity. Leakages are any money not returned to the production cycle, such as savings, taxes, and money spent on imports, while injections are additional funds put into the economy, like investments, government spending, and export revenues. Understanding this model helps students grasp how economic policies can affect national income and price determination.
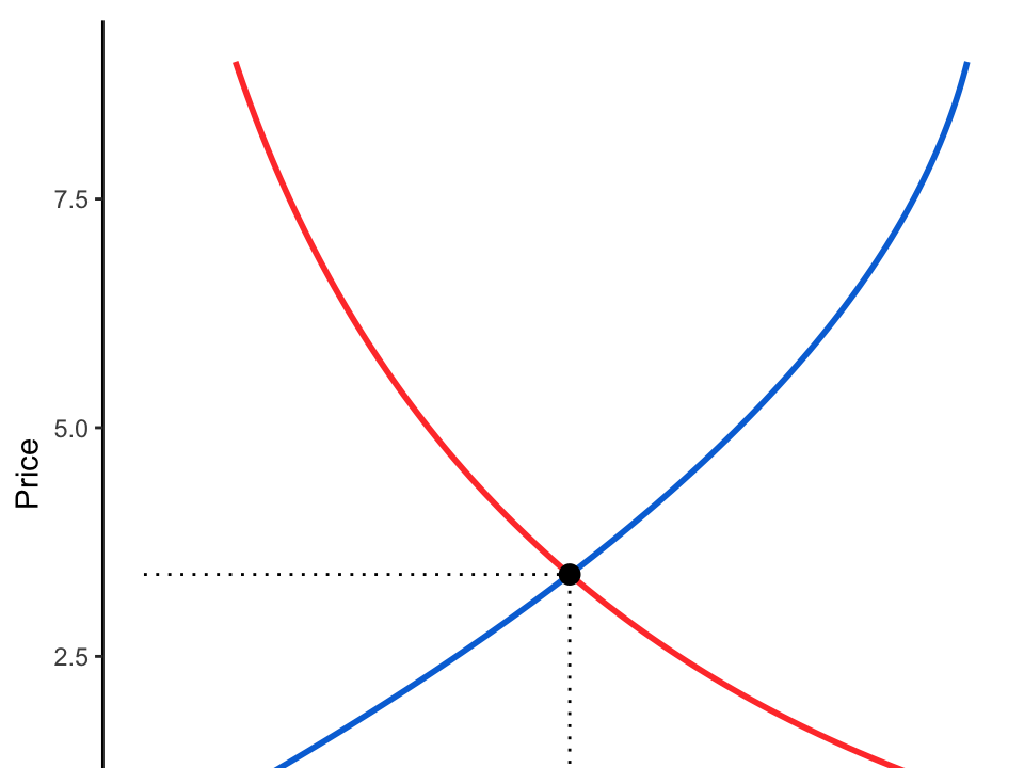
Price Determination in Economics
– Understanding supply and demand
– The relationship between the quantity of a commodity that producers wish to sell at various prices and the quantity that consumers wish to buy.
– Finding market equilibrium price
– The price at which the quantity of a product offered is equal to the quantity of the product in demand.
– Analyzing supply and demand shifts
– Shifts in supply or demand can be due to factors like changes in consumer preference, income levels, or production costs.
– Impact on market equilibrium
– These shifts can lead to a new equilibrium price and quantity in the market.
|
This slide introduces the fundamental concepts of price determination within the framework of AP College Macroeconomics. Begin with the law of supply and demand, explaining how prices are the result of the interaction between sellers and buyers. Discuss market equilibrium price as the point where the quantity supplied equals the quantity demanded. Highlight how shifts in supply and demand, caused by various economic factors, can affect the equilibrium price and quantity. Use real-life examples such as the impact of technological advancements on production costs or how a trend can increase demand for a product. This will help students grasp the dynamic nature of markets and the continuous process of price determination.
Aggregate Demand and Supply: Equilibrium
– Understanding Aggregate Demand (AD)
– AD represents the total demand for goods and services in an economy at different price levels.
– Factors influencing AD
– Consumer spending, investment, government spending, and net exports can shift the AD curve.
– Aggregate Supply (AS) overview
– AS reflects the total output of goods and services produced by an economy at a given price level.
– Short-Run vs Long-Run Equilibrium
– In the short-run, prices are sticky, affecting equilibrium; in the long-run, prices adjust, leading to a new equilibrium.
|
This slide introduces the concepts of Aggregate Demand (AD) and Aggregate Supply (AS), which are crucial for understanding national income and price determination in macroeconomics. AD is the sum of all demand in the economy, whereas AS represents the total supply. Various factors can affect both AD and AS, such as changes in consumer confidence or production costs, which in turn influence the overall economic equilibrium. It’s important to distinguish between short-run and long-run equilibria, as they demonstrate how economies adjust to changes over different time frames. In the short run, prices may not fully adjust to shifts in AD or AS, leading to temporary disequilibrium. However, in the long run, price flexibility allows the economy to reach a new equilibrium. Encourage students to consider real-world examples of factors that might shift AD and AS, such as tax policy changes or technological advancements.
The Multiplier Effect in Macroeconomics
– Understanding the Multiplier
– The Multiplier magnifies initial changes in spending to a greater change in GDP.
– How to calculate the Multiplier
– It’s calculated as 1/(1-MPC) where MPC is the marginal propensity to consume.
– Multiplier’s impact on National Income
– An initial change in spending leads to a proportionally larger change in National Income.
– Exploring real-world implications
|
This slide introduces the concept of the Multiplier Effect, a crucial component in Keynesian economic theory. The Multiplier Effect explains how an initial injection of spending (government or private) can lead to a larger increase in the overall economic output. It’s important for students to grasp that the Multiplier is based on the marginal propensity to consume (MPC), which reflects the increase in consumer spending arising from an increase in disposable income. The implications for National Income are significant, as it shows how economies can potentially leverage fiscal policy to stimulate growth. Use real-world examples, such as government stimulus packages, to illustrate the Multiplier Effect in action. Encourage students to think critically about the limitations and assumptions of the Multiplier model.
Inflation and Deflation in Macroeconomics
– Define Inflation and Deflation
– Inflation is rising prices, deflation is falling prices.
– Causes and effects on economy
– Inflation can reduce purchasing power, deflation can lead to decreased investment.
– Policies to manage inflation
– Use of monetary policy like altering interest rates.
– Policies to curb deflation
– Fiscal policies like increasing government spending.
|
This slide aims to explain the concepts of inflation and deflation, their impact on national income, and the policies used to control them. Inflation refers to the general increase in prices and fall in the purchasing value of money, while deflation is the decrease in the general price level of goods and services. Both phenomena can significantly affect the economy by influencing consumer behavior, investment, and the overall economic growth. To manage inflation, governments and central banks may use monetary policies such as raising interest rates to curb spending. To combat deflation, they might implement fiscal policies like increasing government expenditure to stimulate demand. It’s crucial for students to understand these concepts as they form the basis for many decisions made by economic policymakers.
Class Activity: National Income Simulation
– Divide into economic sector groups
– Make sector-specific decisions
– Calculate National Income changes
– Use the formula: Change in National Income = Multiplier x Initial Change in Spending
– Understand the Multiplier Effect
– The Multiplier Effect shows how spending is amplified in the economy
|
This interactive class activity is designed to help students understand the concept of National Income and the Multiplier Effect in a practical, hands-on way. By dividing the class into groups representing different sectors such as households, businesses, government, and foreign trade, students can simulate how decisions within each sector can impact the overall economy. Provide each group with scenarios that require them to make decisions that affect their sector’s income. Then, guide them to calculate the resultant change in National Income using the Multiplier Effect formula. This activity will help students see the interconnectedness of economic sectors and the significance of the Multiplier Effect in national income determination. Possible scenarios include changes in government spending, investment by businesses, and consumer spending habits. Encourage each group to discuss the potential ripple effects of their decisions on other sectors.