


Analyze Graphed Relationships
Subject: Math
Grade: Fifth grade
Topic: Coordinate Plane
Please LOG IN to download the presentation. Access is available to registered users only.
View More Content


Welcome to Coordinate Planes!
– Basics of a coordinate plane
– A flat surface with two number lines: horizontal (x-axis) and vertical (y-axis).
– Explore the x-axis and y-axis
– x-axis is horizontal, y-axis is vertical. Together, they form a grid where we plot points.
– Coordinate plane applications
– Used in math to show relationships between numbers and to solve problems.
– Real-life relevance of coordinate planes
– Helps in mapping locations, in video games for graphics, and more practical uses.
|
This slide introduces students to the concept of coordinate planes, which are fundamental in understanding graphed relationships in mathematics. Start by explaining the two-dimensional plane with perpendicular number lines, the x-axis (horizontal) and the y-axis (vertical). Emphasize how every point on the plane is defined by an (x, y) coordinate pair. Discuss how coordinate planes are used in various mathematical concepts, including graphing equations and inequalities. Highlight the practical applications of coordinate planes in real life, such as in geography for mapping, in architecture for blueprints, and in technology for video game design. Encourage students to think of other ways coordinate planes might be used in everyday life.
Plotting Points on the Coordinate Plane
– How to plot coordinates
– Use the x and y axes to place a point
– Let’s plot points together
– We’ll practice with examples on the board
– Finding points’ coordinates
– Look at a point and tell its x and y
– Understanding the coordinate system
– The plane is a map for locating points
|
This slide introduces students to the concept of plotting points on a coordinate plane. Begin by explaining the x (horizontal) and y (vertical) axes and how they intersect at the origin (0,0). Demonstrate how to plot a point by moving right or left for the x-coordinate and up or down for the y-coordinate. Engage the class with a collaborative activity where students come to the board to plot points. Then, show points on a plane and ask students to identify their coordinates. Reinforce the idea that the coordinate plane is like a map that helps us find the exact location of points. Provide several examples and encourage students to ask questions for clarification.
Creating Graphs on the Coordinate Plane
– Plotting points to create a graph
– Use an ordered pair of numbers (x, y) to plot each point
– Graphs illustrate number relationships
– See how one number affects another on the graph
– Example: A linear relationship graph
– Draw a line through points that show a steady increase or decrease
– Practice with different data sets
|
This slide introduces students to the concept of creating graphs on a coordinate plane. Students will learn to plot points using ordered pairs (x, y) and understand how these points can form a graph that represents a relationship between numbers. Emphasize that the ‘x’ value is always read first, followed by the ‘y’ value. Use a simple linear relationship, such as height over time, as an example to show a direct relationship where one variable increases or decreases consistently with the other. Encourage students to practice plotting points from different data sets to become familiar with various types of relationships that can be represented on a graph.
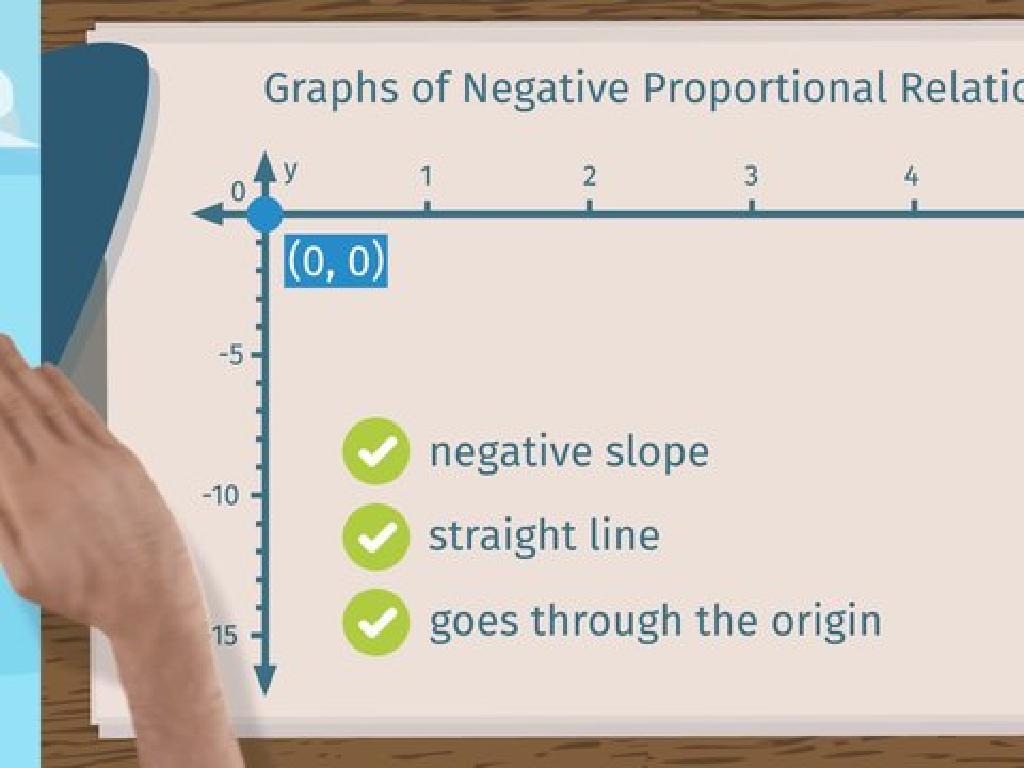
Analyzing Graphs on the Coordinate Plane
– Reading graphs correctly
– Look at the x and y axes to understand the data points
– Recognizing patterns and trends
– Patterns can show if data is increasing or decreasing
– Interpreting the slope of a line
– Slope shows how steep the line is on the graph
– Slope indicates rate of change
– A steeper slope means a faster change
|
This slide introduces students to the basics of analyzing graphed relationships. Start by explaining how to read the axes of a graph and identify data points. Discuss how to observe patterns and trends, such as increases or decreases over time. Explain that the slope of a line graph represents the rate of change, with steeper slopes indicating more rapid changes. Use examples like speed over time or growth of a plant to illustrate these concepts. Encourage students to ask questions and provide them with simple graphs to practice these skills.
Real-World Applications of Coordinate Planes
– Coordinate planes in daily life
– Examples: weather, markets, maps
– Weather charts predict rain or shine, market trends show stock prices, maps help us navigate.
– Discuss other graph uses
– Think about games, sports scores, or even your height chart at home!
– Understand graphs’ importance
|
This slide aims to help students connect the concept of coordinate planes and graphing to real-world scenarios. Start by explaining how coordinate planes are not just a mathematical concept but a tool used in various fields. Provide concrete examples such as weather charts for meteorology, market trends for economics, and map reading for geography. Encourage a group discussion to brainstorm other areas where graphs are utilized, such as in healthcare for tracking patient vitals or in sports for analyzing player statistics. This will help students realize the practical importance of understanding graphs and inspire them to learn more about how math is applied in everyday life.
Class Activity: Create Your Own Graph!
– Receive a set of data to plot
– Create a graph on a coordinate plane
– Present your graph to the class
– Explain the relationship shown
– Is it a straight line? Does it go up or down?
|
In this activity, students will apply their knowledge of the coordinate plane to create a graph from a given set of data. This hands-on experience reinforces their understanding of graphed relationships. Distribute different data sets to each student to ensure a variety of graphs. Provide graph paper and necessary tools like rulers. Guide them through plotting points and drawing the graph. Encourage creativity but ensure accuracy in their representation. When presenting, students should articulate the type of relationship their graph represents, such as linear or non-linear, and whether the relationship indicates positive or negative correlation. Possible variations of the activity could include pairing students to compare their graphs, using digital tools to create the graphs, or interpreting classmates’ graphs instead of their own.
Wrapping Up: Graphs and Relationships
– Recap: Analyzing graph relationships
– Homework: Find and describe a graph
– Look for graphs in newspapers or online and write about what they show.
– Next class: Introduction to functions
– We’ll explore how functions relate to graphs.
– Keep practicing graph analysis
– Practice helps understand how graphs tell stories.
|
As we conclude today’s lesson, remind students of the key points we’ve covered about analyzing relationships in graphs on the coordinate plane. For homework, students should find a real-world graph and write a few sentences describing the relationship it shows. This will help them apply what they’ve learned to real-life scenarios. In preparation for the next class, give a brief teaser about the concept of functions, which we will explore in more detail. Encourage students to keep practicing with graphs they come across in their daily lives, as this will reinforce their understanding of how to analyze graphed relationships.
