


Identify Graphs: Word Problems
Subject: Math
Grade: Eighth grade
Topic: Interpret Functions
Please LOG IN to download the presentation. Access is available to registered users only.
View More Content
Identifying Graphs through Word Problems
– Graphs as visual functions
– Each graph plots a function that shows a relationship between two variables.
– Steps to interpret graphs
– Identify variables, find patterns, and use the graph’s scale to understand the function.
– Real-world graph applications
– Graphs can represent trends in economics, science, and more.
– Practice with example problems
– We’ll solve problems together to apply what we’ve learned.
|
This slide introduces students to the concept of interpreting functions through graphs within word problems. Emphasize that graphs are a visual representation of functions, showing the relationship between two variables. Walk students through the steps of interpreting these graphs by identifying the variables involved, recognizing patterns, and understanding the scale and labels on the graph. Highlight the importance of this skill by discussing real-world applications, such as predicting trends in economics or understanding scientific data. Conclude with hands-on practice by working through example problems as a class, reinforcing the concepts taught.
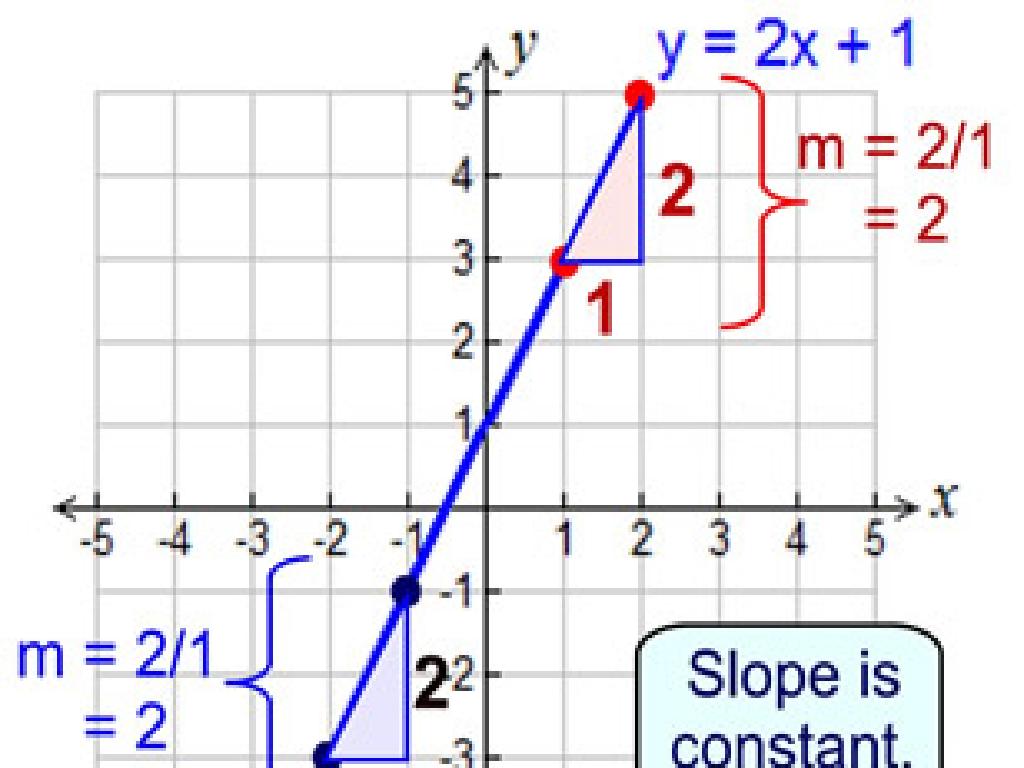
Understanding Functions in Graphs
– Define a mathematical function
– A function relates each input to exactly one output
– Relationship between functions & graphs
– Graphs visually represent functions, showing how inputs affect outputs
– Graph examples of simple functions
– Consider f(x) = x + 2 or f(x) = x^2 and their respective linear and parabolic graphs
– Interpretation of function graphs
– Analyzing the graph to understand function behavior, like constant or changing rates
|
This slide introduces the concept of a function, which is fundamental in mathematics, especially in algebra. A function is defined as a relation that assigns exactly one output for each input. The relationship between functions and graphs is crucial as graphs provide a visual representation of functions, allowing students to see how inputs (x-values) are related to outputs (y-values). By examining graphs of simple functions such as linear functions (f(x) = x + 2) or quadratic functions (f(x) = x^2), students can learn to interpret the rate of change and the shape of the graph. Encourage students to practice plotting points and drawing graphs for different functions to solidify their understanding.
Graph Types and Interpretation
– Linear vs. Non-linear graphs
– Linear graphs are straight lines; non-linear can be curves or other shapes.
– Positive vs. negative slopes
– Positive slope rises to the right; negative slope falls to the right.
– Understanding the x-axis and y-axis
– The x-axis runs horizontally, y-axis runs vertically.
– Interpreting graphs with word problems
– Use graph data to solve real-world problems.
|
This slide introduces students to the basic concepts of graph interpretation, crucial for understanding functions in algebra. Linear graphs represent constant rates of change, while non-linear graphs show variable rates. Slopes indicate the direction and steepness of a line, with positive slopes going upward and negative slopes going downward. The x-axis and y-axis are the foundation of the coordinate plane, with the x-axis typically representing the independent variable and the y-axis the dependent variable. Students should learn to apply these concepts to word problems, translating narrative descriptions into graphical representations. Encourage students to practice by creating their own word problems and corresponding graphs.
Reading Graphs: Word Problems
– How to read a graph effectively
– Understand the axes, labels, and what they represent
– Comprehend scales and intervals
– Scales determine the value of each division, intervals are the spaces between divisions
– Interpret points on the graph
– Each point on a graph corresponds to a specific event or number
– Practice with real-world problems
– Use examples like temperature over a week or class test scores
|
This slide is aimed at teaching students how to read and interpret graphs, a crucial skill in understanding word problems related to functions. Start by explaining the components of a graph, including axes, labels, and legends. Emphasize the importance of scales and intervals in accurately interpreting data. Show how to read individual points and what they represent in the context of a problem. Provide real-world examples, such as tracking daily temperatures or analyzing class test scores, to illustrate these concepts. Encourage students to practice by assigning problems that require them to apply these skills.
Word Problems and Graphs: Visual Interpretation
– Translate problems into graphs
– Turn a story problem into a visual graph
– Identify key problem information
– Look for numbers, relationships, and changes
– Practice with a conversion example
– Use a real-world example to create a graph
– Discuss graph interpretation skills
|
This slide is aimed at teaching students how to take information from word problems and represent it visually using graphs. Start by explaining the process of translation from text to visual data. Emphasize the importance of identifying crucial information such as numerical data, relationships among variables, and how these change over time. Provide a practice problem where students can apply these skills by converting a word problem into a graph. This could involve plotting points on a coordinate plane or interpreting data in a given scenario. Encourage students to discuss how graph interpretation can help in understanding and solving word problems. As an activity, students can work in groups to translate different word problems into graphs and then present their findings to the class.
Graphs in Real Life
– Everyday use of graphs
– Weather pattern graphs
– Visualize temperature changes over time
– Stock market trend graphs
– Track the rise and fall of stock prices
– Population growth graphs
– Show the increase or decrease in population size
|
This slide aims to show students the practical application of graphs in various real-life situations. Graphs are essential tools for visualizing data and making it understandable at a glance. For instance, weather graphs can help us see how temperatures fluctuate throughout the year, which is crucial for planning activities or understanding climate change. Stock market graphs are vital for investors to make informed decisions by observing the historical performance of stocks. Population growth graphs can indicate trends in birth rates, death rates, and migration, which are important for urban planning and resource allocation. Encourage students to think of other areas where graphs are used and discuss the importance of being able to interpret them correctly.
Class Activity: Graphing Stories
– Create graphs from stories
– Group presentations
– Each group will share their graph with the class
– Explain your graph
– Describe the story’s events through your graph
– Discuss interpretation differences
– How can the same story lead to different graphs?
|
This activity is designed to help students apply their understanding of graphs to real-world scenarios. Students will listen to or read short stories and then work in groups to create a graph that represents the story. Each group will then present their graph to the class and explain how they chose to represent the story’s events. After all presentations, lead a discussion on how different groups may have interpreted the story differently, resulting in unique graphs. This will help students see the importance of perspective in data representation and enhance their critical thinking skills. Possible activities: 1) Graph a character’s happiness over time, 2) Graph the speed of a vehicle in a chase scene, 3) Graph the rising tension in a mystery story, 4) Graph the population changes in a story about a town, 5) Graph the altitude of a hiker’s journey up a mountain.
Homework: Analyzing Graphs in News Articles
– Find a news article with a graph
– Write a paragraph about the graph
– Summarize what the graph shows
– Explain the graph’s significance
– Relate the graph to the article’s topic
– Get ready for class discussion
|
This homework assignment is designed to help students apply their knowledge of interpreting graphs to real-world situations. Students are tasked with finding a news article that includes a graph, which will give them insight into how graphs are used to support information and arguments in media. They must write a paragraph explaining what the graph shows, including details about the data presented and its relevance to the news story. Encourage students to think critically about the role of the graph in the article and what it adds to the reader’s understanding. In the next class, there will be a discussion where students can share their findings, compare different types of graphs, and reflect on the importance of data visualization in everyday life.
