


Graph Inequalities On Number Lines
Subject: Math
Grade: Eighth grade
Topic: One-Variable Inequalities
Please LOG IN to download the presentation. Access is available to registered users only.
View More Content


Understanding One-Variable Inequalities
– Define inequalities
– Inequalities show how values relate, not equal but , d, or e.
– Explore one-variable inequalities
– One-variable inequalities involve only one unknown, like x > 5.
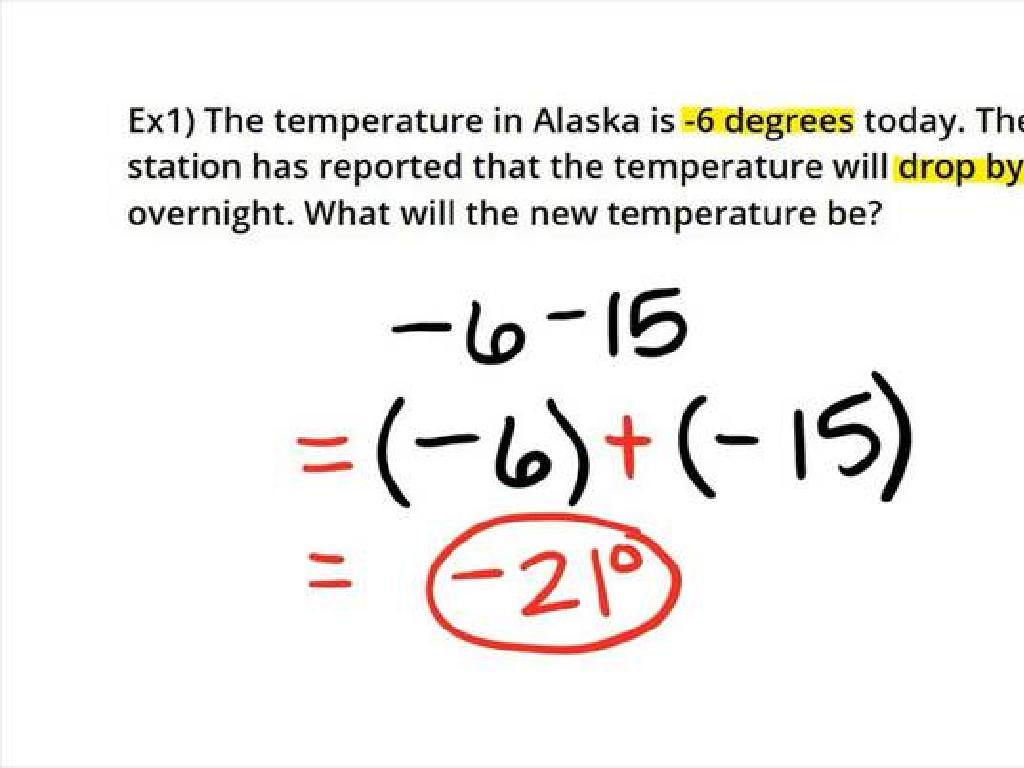
– Real-world inequality examples
– Budgeting: Income > Expenses, or Temperature /< or e/d on a line.
|
This slide introduces the concept of inequalities and their application to real-life situations. Start by explaining that inequalities are a way to compare values that are not necessarily equal, using symbols like less than, greater than, and their ‘or equal to’ counterparts. Then, focus on one-variable inequalities, which involve a single unknown quantity. Provide relatable examples such as budgeting, where income should be greater than expenses, or weather-related scenarios, like temperatures being below the freezing point. Finally, demonstrate how to graph these inequalities on a number line, using open or closed dots to indicate whether the endpoint is included in the solution set. Encourage students to think of other daily examples where inequalities are present and to practice graphing them.
Understanding Inequalities
– Define inequality in math
– An inequality shows the relationship where one value is not equal to the other.
– Symbols: greater than, less than
– ‘>’ means greater than, ‘<' means less than.
– Notation of inequality symbols
– Symbols include e (greater than or equal to) and d (less than or equal to).
– Interpreting inequalities
– How to read and understand what inequalities tell us about numbers.
|
Begin with the definition of an inequality, emphasizing that it compares two values to show if one is larger, smaller, or not equal to the other. Introduce the symbols for greater than (>) and less than (<), and explain that these are the basic building blocks of inequalities. Move on to the notation, including greater than or equal to (e) and less than or equal to (d), and discuss how these symbols are used to represent ranges of numbers. Conclude by explaining how to interpret inequalities on a number line, which will be the foundation for graphing them. Encourage students to think of real-life situations where inequalities are applicable, such as age restrictions for games or height requirements for rides.
Graphing Inequalities on a Number Line
– Drawing a number line
– Start with a horizontal line, mark zero, and evenly space numbers.
– Plotting inequality points
– Place a point where the inequality is true.
– Open vs. closed circles
– Open circle: value not included. Closed circle: value included.
– Interpreting circle symbols
– Open circle means ‘less than’, closed means ‘less than or equal to’.
|
This slide introduces students to the concept of graphing inequalities on a number line. Begin by explaining how to draw a number line, emphasizing the importance of spacing numbers evenly and including zero as a reference point. Then, demonstrate how to plot points that represent solutions to inequalities. Discuss the difference between open and closed circles, explaining that an open circle indicates that the value is not included in the solution set (for ‘less than’ or ‘greater than’), while a closed circle means the value is included (‘less than or equal to’ or ‘greater than or equal to’). Use examples to illustrate these concepts, such as x > 3 or x d 5, and have students practice plotting these on number lines. Encourage students to ask questions and provide several practice problems for them to solve independently.
Graphing Inequalities on Number Lines
– Graph x > 3 on a number line
– Place an open circle on 3 and shade to the right
– Graph x d -2 on a number line
– Place a closed circle on -2 and shade to the left
– Understand shading direction
– Shading right means greater than, left means less than or equal
– Discuss open and closed circles
– Open circle for ‘greater than’, closed for ‘less than or equal’
|
This slide aims to visually demonstrate how to graph one-variable inequalities on a number line. Start by graphing x > 3 with an open circle on 3 to indicate that 3 is not included in the solution set, and shade to the right to show all numbers greater than 3 are included. For x d -2, use a closed circle on -2 to include -2 in the solution set, and shade to the left to represent all numbers less than or equal to -2. Explain the rationale behind shading directions: right for ‘greater than’ and left for ‘less than’. Emphasize the difference between open and closed circles to represent strict inequalities versus inclusive ones. Encourage students to practice with additional examples and to explain their reasoning for the shading direction and circle type.
Graphing Inequalities Practice
– Graphing x < 5 on a number line
– Mark a point at 5, shade left for values less than 5
– Graphing x e -4 on a number line
– Mark a point at -4, shade right including -4 for values greater or equal
|
This slide is designed for a class activity where students will practice graphing inequalities on number lines. For the first example, students should place an open circle at 5 on the number line and shade all the numbers to the left, indicating all the numbers less than 5. For the second example, students will place a closed circle at -4 and shade to the right, showing all numbers greater than or equal to -4. Encourage students to remember the difference between open and closed circles and the direction of shading. Possible activities include pairing students to check each other’s work, creating similar problems for additional practice, or asking students to come to the board to demonstrate their understanding.
Class Activity: Graphing Inequalities
– Pair up and get inequality sets
– Graph inequalities on worksheets
– Use open/closed circles to represent or e
– Discuss graphing techniques
– Share tips on how to determine the correct shading direction
– Present graphs to the class
|
This activity is designed to reinforce students’ understanding of graphing inequalities on number lines. Students will work in pairs to encourage collaboration and peer learning. Each pair will receive a unique set of inequalities to graph, which will help them practice identifying solutions and representing them visually. Emphasize the importance of correctly using open and closed circles, and shading the number line to indicate all possible solutions. After completing the graphs, students will share their work with the class, allowing them to explain their reasoning and demonstrate their understanding. This will also provide an opportunity for the teacher to address any misconceptions. Possible inequalities for the activity could include x < 3, x e -2, -1 4.
Homework and Next Steps: Mastering Inequalities
– Complete inequality graphing worksheet
– Study for the upcoming inequalities quiz
Review notes and try additional problems for preparation.
– Next class: Solving inequalities
We’ll learn methods to solve inequalities algebraically.
– Practice makes perfect!
|
For homework, students are expected to complete a worksheet that provides practice on graphing inequalities on number lines, reinforcing today’s lesson. Encourage them to review their class notes and attempt extra problems to prepare for the quiz on one-variable inequalities. The next class will focus on solving one-variable inequalities algebraically, which will require students to apply inverse operations and understand solution sets. Provide students with study tips and remind them that consistent practice is key to mastering the concepts. Offer to provide additional resources or support for students who may need extra help.
