Graph Solutions To One-Step Inequalities
Subject: Math
Grade: Eighth grade
Topic: One-Variable Inequalities
Please LOG IN to download the presentation. Access is available to registered users only.
View More Content
Introduction to One-Step Inequalities
– Inequalities: Beyond Equality
– Inequalities show relationships where one side isn’t equal to the other.
– Defining One-Step Inequalities
– One-step inequalities involve a single operation to solve.
– Real-World Inequality Scenarios
– Examples: temperature, bank balances, or height restrictions.
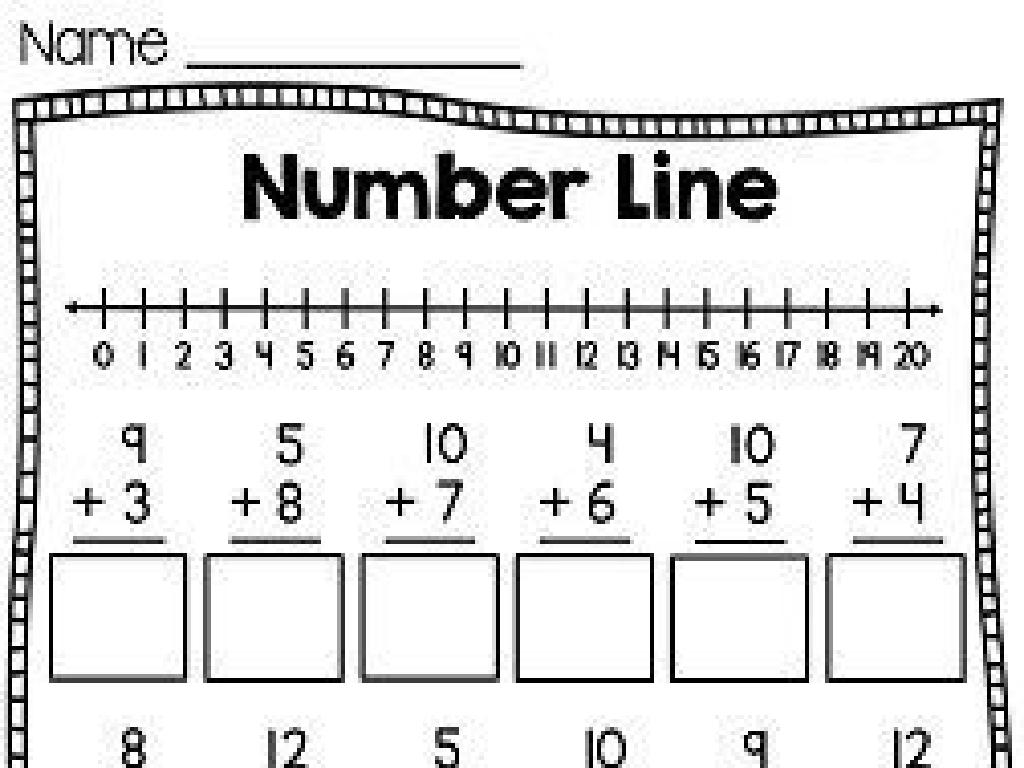
– Graphing Inequalities on a Number Line
|
Begin by explaining that inequalities are like equations, but instead of an equal sign, they use symbols to show that one side is greater than, less than, or not equal to the other side. Introduce one-step inequalities as the simplest form of inequalities that can be solved with one operation (addition, subtraction, multiplication, or division). Provide real-life examples where inequalities are used, such as minimum height requirements for rides at an amusement park or minimum balance for a bank account. Conclude by showing how these inequalities can be represented visually on a number line, which will be covered in more detail in subsequent slides. Encourage students to think of other everyday situations where inequalities apply.
Understanding Inequality Symbols
– ‘Greater Than’ (>) meaning
– ‘>’ means one value is larger than another
– ‘Less Than’ (<) meaning
– '<' indicates a value is smaller than another
– 'Greater/Less Than or Equal To' (e/d)
– 'e' and 'd' include the number itself
– 'Not Equal To' (`) in inequalities
– '`' shows values are not the same
|
This slide introduces students to the fundamental symbols used in one-step inequalities and their meanings. The ‘greater than’ symbol (>) indicates that one value is larger than the other, while the ‘less than’ symbol (<) shows the opposite. When the 'equal to' component is added, forming 'greater than or equal to' (e) and 'less than or equal to' (d), it signifies that the value could also be equal to the reference value. The 'not equal to' symbol (`) is crucial for expressing that two values are not the same, which is a concept that can appear in inequalities. Understanding these symbols is essential for graphing solutions to one-step inequalities. Encourage students to practice by creating simple inequalities using these symbols and graphing them on a number line.
Graphing Inequalities on a Number Line
– Define a Number Line
– A visual representation of numbers in order, allowing us to compare and plot them.
– How to plot inequalities
– Use a number line to show the range of values that satisfy an inequality.
– Open vs. Closed Circles
– Open circles represent ‘less than’ or ‘greater than’ while closed circles mean ‘less than or equal to’ or ‘greater than or equal to’.
– Practice plotting points
|
This slide introduces students to the concept of graphing inequalities on a number line. Begin with explaining what a number line is and its purpose. Then, demonstrate how to plot inequalities, emphasizing the difference between open and closed circles. Open circles indicate that the number at that point is not included in the solution (for ‘less than’ or ‘greater than’), while closed circles show that the number is included (for ‘less than or equal to’ or ‘greater than or equal to’). Provide students with practice problems to plot points on a number line to solidify their understanding. Encourage students to ask questions and discuss any difficulties they encounter while learning to graph inequalities.
Solving One-Step Inequalities
– Isolate the variable on one side
– Move all variables to one side of the inequality
– Use addition or subtraction
– Depending on the inequality, add or subtract to both sides
– Check the solution
– Substitute the solution back into the original inequality to verify
– Graph the solution on a number line
– Draw a number line and shade the region representing the solution set
|
This slide introduces students to the process of solving one-step inequalities. Start by explaining the importance of isolating the variable to one side of the inequality, which simplifies the problem. Demonstrate how to use addition or subtraction to balance the inequality, ensuring students understand that what is done to one side must be done to the other. Emphasize the importance of checking the solution by substituting it back into the original inequality. Conclude by showing how to represent the solution graphically on a number line, which provides a visual understanding of the range of possible solutions. Provide several examples and encourage students to practice each step to gain confidence in solving one-step inequalities.
Graphing One-Step Inequalities
– Solve x + 5 > 7
– Subtract 5 from both sides to find x > 2
– Solve 3y d 9
– Divide both sides by 3 to find y d 3
– Solve -2z -4
– Graph solutions on a number line
|
This slide is aimed at teaching students how to solve and graph one-step inequalities. Start with simple addition and subtraction, such as in Example 1, where students will learn to isolate the variable by performing inverse operations. In Example 2, students will practice division as the inverse operation to solve for the variable. Example 3 introduces the concept of reversing the inequality when multiplying or dividing by a negative number. After solving, students will graph the solutions on a number line, reinforcing the concept that inequalities have a range of solutions. Encourage students to check their solutions by picking a number within the solution set and substituting it back into the original inequality.
Graphing One-Step Inequalities: Practice
– Solve: a – 4 e 3
– Add 4 to both sides: a e 7
– Graph solution on a number line
– Plot a closed circle on 7 and shade to the right
– Solve: -3n d 12
– Divide both sides by -3: n e -4 (Remember to flip the inequality sign!)
– Solve: 1/2p > -4
– Multiply both sides by 2: p > -8
|
This slide presents practice problems for students to solve and graph one-step inequalities. Start by solving the inequality ‘a – 4 e 3’ by isolating the variable. Then, graph the solution on a number line, ensuring students understand the meaning of a closed circle and shading to the right for ‘greater than or equal to.’ Repeat the process for ‘-3n d 12,’ reminding students to reverse the inequality when multiplying or dividing by a negative number. For ‘1/2p > -4,’ guide students through multiplying both sides to clear the fraction. Encourage students to check their solutions by substituting values back into the original inequalities. Provide additional practice problems for students who finish early or need extra challenge.
Class Activity: Inequality Match-Up
– Pair up and solve inequalities
– Match solutions with board graphs
– Discuss graph-solution correlation
– Why does your graph show the correct solution?
– Reflect on the activity
– Share what you learned with the class
|
This interactive class activity is designed to reinforce students’ understanding of graphing one-step inequalities. Students will work in pairs to solve a set of inequalities provided by the teacher. Once they have their solutions, they will match them with pre-drawn graphs on the board. This requires them to critically analyze the relationship between the inequality and its graphical representation. After matching, each pair will discuss why their chosen graph correctly represents the solution to their inequality. To conclude, students will reflect on what they learned during the activity and share insights with the class. For the teacher: Prepare a set of inequalities and corresponding graphs on the board before class. Ensure there are enough variations for all pairs. Consider having different difficulty levels to cater to varying student abilities. After the activity, facilitate a class discussion to address any misconceptions and highlight key learning points.
Conclusion: Mastering One-Step Inequalities
– Recap: Solving one-step inequalities
– Review how to solve inequalities like x + 3 > 5
– Graphing’s role in understanding inequalities
– Visual graphs help see solutions at a glance
– Methods to verify solutions
– Substitute values into original inequality to check
– Confidence in inequality solutions
|
As we wrap up, let’s review the key concepts of one-step inequalities. Remind students that solving these inequalities involves finding a range of values that make the inequality true. Emphasize the importance of graphing these solutions on a number line, as it provides a visual representation of all possible solutions. Teach students to always check their work by substituting the solution back into the original inequality to ensure it holds true. This not only reinforces their understanding but also builds their confidence in solving inequalities. Encourage students to practice with different inequalities to become proficient.
Homework: Graphing One-Step Inequalities
– Complete inequality worksheet
– Graph inequalities on number line
– Plot the solution set of each inequality
– Be ready to discuss solutions
– Practice interpreting graphs
– Understand how the graph represents solutions
|
This homework assignment is designed to reinforce students’ understanding of one-step inequalities and their graphical representations. Students are expected to solve the inequalities on the provided worksheet and then accurately graph the solution sets on a number line. Emphasize the importance of correctly using open and closed circles to represent inequalities. Encourage students to check their solutions by substituting values into the original inequalities. In the next class, there will be a discussion to address any questions and to ensure comprehension. Provide examples of inequalities and their graphs on the board for reference. Possible activities for different students could include graphing different types of inequalities, using online graphing tools, or creating their own set of inequalities to solve and graph.

