


Graph Inequalities On Number Lines
Subject: Math
Grade: Seventh grade
Topic: One-Variable Inequalities
Please LOG IN to download the presentation. Access is available to registered users only.
View More Content


Graphing One-Variable Inequalities
– Understanding inequalities
– Inequalities show how values relate, not equal but , d, or e
– Defining one-variable inequalities
– It’s an inequality with one unknown, e.g., x > 5
– Inequalities in real life
– Budgeting money, scoring in games, or measuring ingredients
– Graphing on number lines
– Plotting solutions on a line to visualize the range of answers
|
This slide introduces students to the concept of one-variable inequalities, which are fundamental in understanding how to represent and solve problems involving numerical relationships that are not strictly equal. Begin by explaining that inequalities are like equations, but instead of saying two things are the same, they show a range of possible solutions. Show how these inequalities can be applied to real-life situations like budgeting or cooking, where amounts are not fixed but have to be greater or less than a certain number. Finally, demonstrate how to graph these inequalities on a number line, which is a visual way to represent all possible solutions to an inequality. Encourage students to think of their own examples and to practice graphing inequalities.
Understanding Inequalities
– Define inequality in math
– An inequality shows how values differ
– Learn inequality symbols
– Symbols: > (greater), < (less), e (greater or equal), d (less or equal)
– Compare inequality and equality
– Unlike =, inequalities show a range of possible solutions
– Graphing inequalities on a line
– Use a number line to represent solutions visually
|
In this slide, we introduce the concept of inequalities, which are statements that describe the relative size or order of two values. It’s crucial to explain the meaning of the different symbols: greater than (>) and less than (<) indicate a strict inequality, while greater than or equal to (e) and less than or equal to (d) include the possibility of equality. Highlight the difference between an inequality and an equation (equal sign), emphasizing that an inequality represents a set of possible solutions rather than a single solution. Demonstrate how to graph these inequalities on a number line, showing open and closed circles to represent strict and inclusive inequalities, respectively. Encourage students to practice by creating their own number line graphs for different inequalities.
Graphing Inequalities on a Number Line
– Understand a number line
– A visual representation of numbers in order
– How to plot points
– Mark the point corresponding to a number
– Open vs closed circles
– Open circle: not included, Closed: included
– Practice with examples
– Use inequalities to place circles and draw lines
|
This slide introduces students to the concept of graphing inequalities on a number line. Begin by explaining what a number line is and how it can be used to represent numbers and their order. Demonstrate how to plot points on a number line. Then, discuss the difference between open and closed circles, emphasizing that open circles represent values that are not included in the inequality, while closed circles represent values that are included. Provide several examples for students to practice plotting inequalities, using both open and closed circles, and drawing lines to represent the range of values included in the inequality. Encourage students to try plotting inequalities themselves and to check their understanding with peers or the teacher.
Graphing One-Variable Inequalities
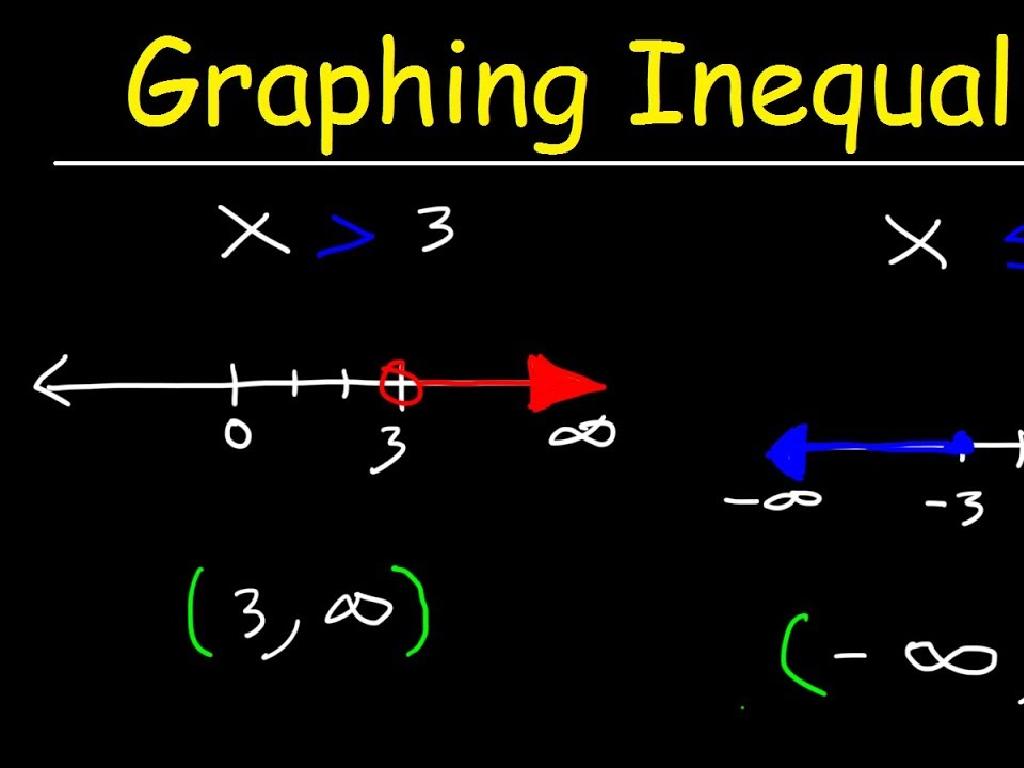
– Graphing x > 3 on a number line
– Plot a point to the right of 3 and draw an arrow to the right
– Graphing y d 7 on a number line
– Plot a point at 7 and shade the line to the left
– Open vs. Closed circles
– Open circle: value not included, Closed circle: value included
– Interpreting inequality graphs
|
This slide introduces students to graphing one-variable inequalities on number lines. Start with the example x > 3, showing that we use an open circle at 3 to indicate that 3 is not part of the solution and an arrow extending to the right to show all numbers greater than 3 are included. For y d 7, use a closed circle at 7 to show that 7 is included in the solution, with a line shaded to the left representing all numbers less than or equal to 7. Discuss the significance of open and closed circles in graphing inequalities and how they help us understand which values are solutions to the inequality. Encourage students to practice by providing additional examples and asking them to graph the inequalities on number lines.
Graphing Inequalities: Class Practice
– Graph the inequality a < 5
– Plot points less than 5, open circle at 5
– Graph the inequality b e -2
– Plot points greater than or equal to -2, closed circle at -2
– Engage in class problem-solving
– Discuss solutions and methods
|
This slide is designed for a class activity where students will practice graphing inequalities on a number line. For the first inequality, a < 5, students should place an open circle at 5 to indicate that 5 is not included and shade all the numbers to the left of 5. For the second inequality, b e -2, students should place a closed circle at -2 to show that -2 is included and shade all the numbers to the right of -2. Encourage class participation by asking volunteers to come to the board to graph the inequalities. Discuss as a class why we use open or closed circles and how to determine which direction to shade. Provide additional examples if time allows and ensure that each student is comfortable with the concept before moving on.
Class Activity: Inequality Number Line Race
– Split into small groups
– Receive a set of inequality problems
– Graph inequalities on number lines
– Use open/closed circles to represent , d, e
– Discuss solutions and strategies
– Share different approaches and learn from each other
|
This activity is designed to encourage collaborative learning and to reinforce the concept of graphing inequalities on number lines. Divide the class into small groups, ensuring a mix of abilities in each. Provide each group with a unique set of inequality problems to solve. The race element adds excitement and a friendly competitive edge to the learning process. Once completed, have each group present their graphs and discuss the strategies they used to determine the correct solutions. Emphasize the importance of correctly using open and closed circles to represent different inequalities. This activity will help students visualize inequalities and understand the solutions in a fun and interactive way. Prepare 4-5 different sets of problems to cater to varying levels of difficulty and ensure that each student is engaged and challenged.
Homework: Mastering Inequalities
– Complete the inequality worksheet
– Finish the worksheet to practice graphing skills
– Create your own inequalities
– Use different numbers and variables to make new problems
– Graph your inequalities
– Draw number lines and plot the solutions
– Study for the upcoming quiz
– Review all notes and practice problems to prepare
|
This homework assignment is designed to reinforce the concepts taught in class about graphing inequalities on number lines. The worksheet provides structured practice, while encouraging students to create their own inequalities offers a deeper understanding of the topic. Graphing their own problems will help students visualize the solutions and solidify their learning. The upcoming quiz will assess their grasp of the material, so they should review their class notes, completed worksheets, and any additional practice problems. Remind students to pay attention to the direction of the inequality symbols and the open or closed circles on the number lines when graphing.
Conclusion: Graphing Inequalities on Number Lines
– Recap of inequality graphing
– Reviewed how to represent inequalities with number lines.
– Why inequalities matter
– Understanding inequalities is crucial for solving real-world problems.
– Encourage curiosity and questions
– It’s okay to have questions; asking them helps you learn!
– Offer help and resources
– Extra help is available through tutoring, online resources, and study groups.
|
As we wrap up today’s lesson on graphing inequalities on number lines, it’s important to revisit the key concepts to ensure understanding. Emphasize the practical applications of inequalities in everyday life and other areas of math. Encourage students to be proactive in seeking clarification on any points of confusion. Remind them of the available resources, such as after-school tutoring, online videos, and practice worksheets. Consider setting up a peer support system where students can help each other with challenging problems. The goal is to foster a supportive learning environment that empowers students to master the topic.
