Identify Proportional Relationships From Graphs And Equations
Subject: Math
Grade: Eighth grade
Topic: Proportional Relationships
Please LOG IN to download the presentation. Access is available to registered users only.
View More Content
Understanding Proportional Relationships
– Define proportional relationships
– A relationship where two quantities increase at the same rate.
– Proportionality in daily life
– Examples: recipes, map reading, and buying in bulk.
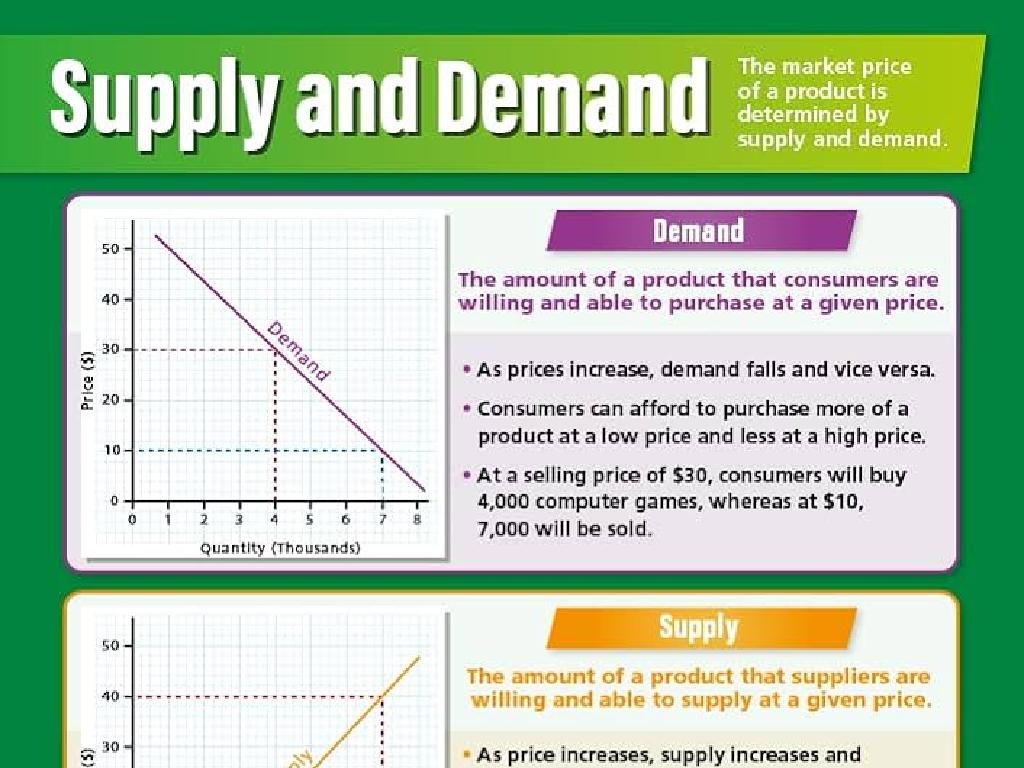
– Graphs show constant rates
– Straight lines through the origin (0,0) indicate proportionality.
– Equations represent proportions
– y = kx, where k is the constant of proportionality.
|
This slide introduces the concept of proportional relationships, a fundamental aspect of algebra and a key to understanding various real-world scenarios. Begin by defining proportional relationships as situations where two variables change at a constant rate relative to each other. Provide relatable examples such as following a recipe, using a map’s scale to calculate distance, or determining cost when buying items in bulk. Explain how proportional relationships can be visualized on a graph, where a straight line through the origin indicates a constant rate of change. Lastly, introduce the equation form y = kx, where k represents the constant of proportionality, and discuss how it can be used to solve problems involving proportional relationships. Encourage students to think of additional examples from their daily lives that involve proportional reasoning.
Understanding Proportional Relationships
– Define proportional relationship
– A relationship where two quantities increase or decrease at the same rate
– Constant rate of change
– The ratio between two variables remains the same
– Example: Car speed
– If a car covers more distance in the same time, the speed is constant
– Example: Recipe ingredients
– Doubling a recipe keeps the ingredient proportions the same
|
This slide introduces the concept of proportional relationships, a fundamental component of algebra and a key topic in 8th-grade mathematics. Begin by defining a proportional relationship as a scenario where two quantities vary in such a way that their ratio remains constant. Emphasize the concept of a constant rate of change, which is the unchanging ratio between two variables in a proportional relationship. Use relatable examples such as the speed of a car (distance over time) and the ratios of ingredients in a recipe to illustrate the concept. These examples will help students grasp the practical applications of proportional relationships and prepare them for identifying these relationships in graphs and equations.
Representing Proportions with Graphs
– Plotting proportional relationships
– Use a straight line through the origin to represent a proportional relationship.
– Characteristics of proportional graphs
– A straight line that passes through the origin (0,0) indicates proportionality.
– Activity: Identify proportionality
– Plot given points on a graph to see if they align in a straight line through the origin.
– Understanding through practice
|
This slide introduces students to the concept of representing proportional relationships using graphs. Emphasize that in a proportional relationship, the graph will always be a straight line that passes through the origin, which means if one variable is multiplied by a factor, the other variable is multiplied by the same factor. During the activity, provide students with sets of points to plot on a graph and determine if they show proportionality. This hands-on activity will help solidify their understanding of the concept. Encourage students to explain why the points they plotted do or do not represent a proportional relationship. Offer several examples with different scales to ensure a comprehensive understanding.
Understanding Proportional Equations
– Equations show proportionality
– Find the constant of proportionality
– ‘k’ is the constant in y=kx, showing the rate of change
– Example: y=3x
– For y=3x, ‘k’ is 3, meaning y is triple of x
– Example: y=½x
– For y=½x, ‘k’ is ½, meaning y is half of x
|
This slide introduces students to the concept of proportional relationships in equations. Emphasize that in proportional equations, the form y=kx is used, where ‘k’ represents the constant of proportionality. This constant shows how much y changes with respect to x. Use the examples y=3x and y=½x to illustrate how ‘k’ affects the relationship between y and x. For y=3x, every time x increases by 1, y increases by 3. Conversely, for y=½x, every time x increases by 2, y increases by 1. Encourage students to think of other examples and to graph these equations to visually see the proportional relationship.
Analyzing Graphs for Proportionality
– Identify proportional relationships
– Straight lines through the origin (0,0) indicate proportionality
– Distinguish proportional vs non-proportional
– Non-proportional graphs do not have a constant ratio or may not pass through the origin
– Group activity: Analyze graphs
– In groups, students will determine if provided graphs represent proportional relationships
– Discuss findings with the class
– Each group will share their analysis and reasoning with the class
|
This slide introduces the concept of identifying proportional relationships in graphs. Emphasize that proportional graphs are straight lines that pass through the origin, indicating a constant ratio between variables. Contrast this with non-proportional graphs, which may be curved, not pass through the origin, or have varying ratios. For the group activity, provide a set of graphs for students to analyze and determine proportionality. Encourage collaboration and critical thinking as they justify their conclusions. After the activity, facilitate a class discussion where groups share their findings and explain their thought process. This will reinforce their understanding and allow them to learn from each other’s perspectives.
Solving Proportional Equations
– Steps to solve proportional equations
– Set up the equation, cross-multiply, and solve for the variable.
– Find the constant of proportionality
– The constant ratio between two proportional quantities, often denoted as ‘k’.
– Practice problems with solutions
– Example: If 4 pens cost $2, how much do 7 pens cost?
|
This slide aims to equip students with the skills to solve proportional equations. Begin by explaining the steps to set up an equation from a word problem, then cross-multiply to find the missing value. Emphasize the importance of finding the constant of proportionality (k), which remains the same throughout the proportional relationship. Provide practice problems that allow students to apply these concepts, such as determining the cost of a different number of items given the cost of a set number. Encourage students to work through the problems and understand each step, reinforcing their ability to identify and solve proportional equations in various contexts.
Class Activity: Proportional Relationship Challenge
– Group task: Graph a proportional relationship
– Individual task: Equation from a graph
– Write y = kx, where k is the constant of proportionality
– Share your graph and equation
– Class discussion on findings
– Discuss how different graphs represent different relationships
|
This activity is designed to foster collaboration and individual analysis of proportional relationships. Divide the class into small groups and provide each with graph paper and a scenario to graph a proportional relationship, such as the cost of fruit per pound. After the group activity, assign each student a different graph and ask them to write the corresponding equation. Once completed, students will share their graphs and equations with the class. Encourage discussion about how the constant of proportionality is represented in both the graph and the equation. Possible variations for individual tasks include different units or contexts, such as speed over time or volume of liquid per container. This will help students understand the concept of proportionality in diverse situations.
Wrapping Up: Proportional Relationships
– Recap: Proportional Relationships
– Proportionality in Math & Life
– Understanding proportions aids in solving real-world problems.
– Homework: Real-life Proportions
– Find a daily example showing proportionality, like recipe ingredients.
– Graph & Equation Representation
– Describe your example with a graph and create an equation to match.
|
As we conclude, recap the key features of proportional relationships, emphasizing their constant rate of change and straight-line graphs through the origin. Highlight the importance of proportionality in various fields such as science, cooking, and economics, where understanding ratios and maintaining balance is crucial. For homework, students should find a proportional relationship in their environment, such as ingredients in a recipe or distance traveled over time, and represent it with both a graph and an equation. This will reinforce their understanding and application of the concept. Encourage creativity and ensure they understand how to translate real-world situations into mathematical representations.


