


Interpret Graphs Of Proportional Relationships
Subject: Math
Grade: Sixth grade
Topic: Proportional Relationships
Please LOG IN to download the presentation. Access is available to registered users only.
View More Content


Interpreting Graphs of Proportional Relationships
– Define proportional relationships
– A proportional relationship is two quantities increasing or decreasing at the same rate.
– Daily life applications
– Examples: recipes, currency exchange, and fuel efficiency.
– Graph interpretation basics
– Understand how to read and interpret graphs representing proportional relationships.
– Preview of today’s lesson
|
This slide introduces the concept of proportional relationships and their significance in everyday contexts. Begin by defining proportional relationships, emphasizing the constant rate of change between two quantities. Provide relatable examples such as following a recipe, converting currencies, or calculating miles per gallon. Then, transition to the importance of graph interpretation, explaining how graphs can visually represent these relationships. Conclude with a preview of the day’s lesson, which will delve deeper into reading and understanding graphs that depict proportional relationships. Encourage students to think of additional examples from their daily lives that might involve proportional relationships.
Understanding Proportional Relationships
– Define proportional relationship
– A relationship where two quantities increase or decrease at the same rate
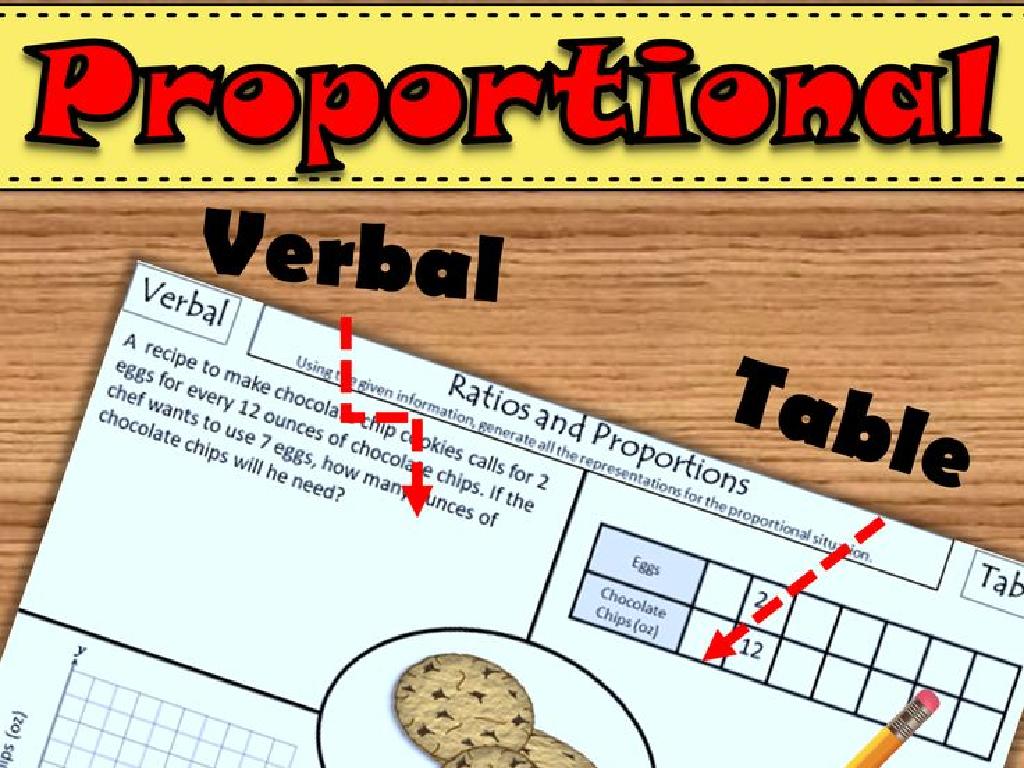
– Real-life examples: recipes, maps
– Recipes use ratios for ingredients, maps show scale distances
– Explore constant of proportionality (k)
– ‘k’ is the ratio between two proportional quantities, y/x
– How ‘k’ relates to graphs
– In graphs, ‘k’ is the slope, showing how y changes with x
|
Introduce the concept of proportional relationships by defining it and explaining that it involves two quantities that change at the same rate. Use relatable examples like recipes, where ingredients are mixed in a certain ratio, or maps, where distances are scaled down proportionally. Discuss the constant of proportionality, ‘k’, which is the consistent ratio in a proportional relationship. Explain how ‘k’ can be found by dividing y by x and is represented as the slope in a graph of the relationship. This will help students visualize and better understand the concept of proportionality in a practical context.
Graphing Proportional Relationships
– Plotting proportions on graphs
– Use ordered pairs to represent proportional relationships on a coordinate plane.
– Slope signifies rate of change
– Slope, or steepness, shows how much y changes for each increase in x.
– Constant of Proportionality (k)
– k is the ratio y/x and is the same for all points on the line.
– Graph interpretation practice
|
This slide introduces students to the concept of representing proportional relationships using graphs. Students will learn how to plot points that show the relationship between two quantities and understand that the slope of the line represents the rate at which these quantities change with respect to each other. Emphasize that in proportional relationships, the slope is constant, and this constant is known as the Constant of Proportionality (k). Encourage students to practice by identifying k on various graphs and interpreting what this constant means in the context of different real-world scenarios. Provide examples and exercises where students can apply these concepts.
Analyzing Graphs of Proportional Relationships
– How to read different graphs
– Compare proportional vs. non-proportional
– Proportional graphs are straight lines through the origin, non-proportional may not be
– Example: Speed vs. Time graph
– A constant speed shows a straight line, indicating a proportional relationship
– Example: Distance vs. Fuel graph
– More distance usually means more fuel used, showing proportionality
|
This slide aims to teach students how to interpret various graphs and understand the concept of proportionality within them. Emphasize the characteristics of proportional graphs, such as the constant rate shown by a straight line through the origin. Use relatable examples like speed versus time to illustrate a scenario where speed remains constant over time, and distance versus fuel to show how distance traveled increases with fuel consumption. Encourage students to think of other real-world examples and discuss how proportionality is depicted graphically. This will help them grasp the practical applications of proportional relationships in everyday life.
Let’s Practice: Graphing Proportional Relationships
– Engage in graph plotting activity
– Group task: Craft your own proportional graph
– Use graph paper or digital tools to plot points that show a proportional relationship between two variables.
– Discuss graph-represented relationships
– How does your graph show a constant rate of change? Share with the class.
– Reflect on the activity’s learning outcomes
– Think about what you’ve learned from plotting and interpreting your graph.
|
This slide is designed for an interactive class activity focused on understanding proportional relationships through graphing. Students will work in groups to plot a graph that represents a proportional relationship between two variables. They will then discuss how their graph demonstrates this relationship, focusing on the constant rate of change. Encourage students to use examples like speed and time, or cost and quantity. After the activity, lead a reflection session where students can discuss what they’ve learned and how they can apply this understanding to real-world scenarios. Provide guidance and support as needed during the activity, and ensure each group understands the concept of proportionality.
Class Activity: Graphing Our Own Proportions
– Each student receives a unique scenario
– Graph the proportional relationship
– Use a graph paper to plot points that show the relationship
– Share and explain your graph with a partner
– Discuss how you determined the points and what they represent
– Engage in a class discussion about the graphs
– Compare different approaches and understandings
|
This activity is designed to provide hands-on experience with graphing proportional relationships. Distribute different scenarios to each student that involve proportional relationships, such as mixing paint colors or calculating speed over time. Provide graph paper and assist students in setting up their axes and plotting points. Once students have created their graphs, they should pair up to explain their scenario and graph to their partner, fostering peer learning. Conclude with a class discussion, allowing students to present their graphs and explain their reasoning. This will help them see the variety of proportional relationships and how they can be represented graphically. Prepare to offer guidance and ensure each student understands the concept of proportionality as it appears in their graph.
Wrapping Up: Graphs & Proportional Relationships
– Review of today’s key concepts
– Why graphs matter in real life
– Graphs help us visualize and understand relationships between quantities.
– Homework: Graph a home example
– Find something that changes in a consistent way, like time spent reading vs. number of pages.
– Be ready to discuss your findings
|
As we conclude today’s lesson, it’s important to recap the key concepts of proportional relationships and their graphical representations. Understanding these concepts is crucial as they apply to many real-world situations. For homework, students are tasked with identifying a proportional relationship within their home environment, such as the amount of ingredients in a recipe or the time spent practicing an instrument versus the improvement shown. They should graph this relationship and be prepared to explain their example in the next class. This exercise will reinforce their understanding and help them recognize the practical applications of proportional relationships in everyday life.
