


Rate Of Change: Tables
Subject: Math
Grade: Seventh grade
Topic: Slope
Please LOG IN to download the presentation. Access is available to registered users only.
View More Content


Understanding Slope and Rate of Change
– Slope represents rate of change
– Slope shows how steep a line is
– Rate of change is a key concept
– It measures how much something changes over time
– It’s crucial in math and real life
– Helps in predicting and understanding patterns
– Examples: Stairs and Graphs
– Stairs show slope in architecture, graphs show economic growth
|
This slide introduces the concept of slope and its real-world applications, emphasizing its importance in both mathematical contexts and everyday life. Slope, often represented as the ‘rise over run’ in a graph, is a measure of how steep a line is. It’s a fundamental concept in algebra that describes the rate of change. Understanding slope helps students grasp how variables interact with each other, which is crucial for solving real-world problems. For example, architects use slope to design ramps and stairs, while economists use it to understand changes in the market. Encourage students to think of other areas where slope and rate of change might be important, such as in sports or driving.
Understanding Slope in Graphs
– Slope represents line steepness
– Slope formula: m = Rise/Run
– ‘Rise’ is vertical change, ‘Run’ is horizontal change
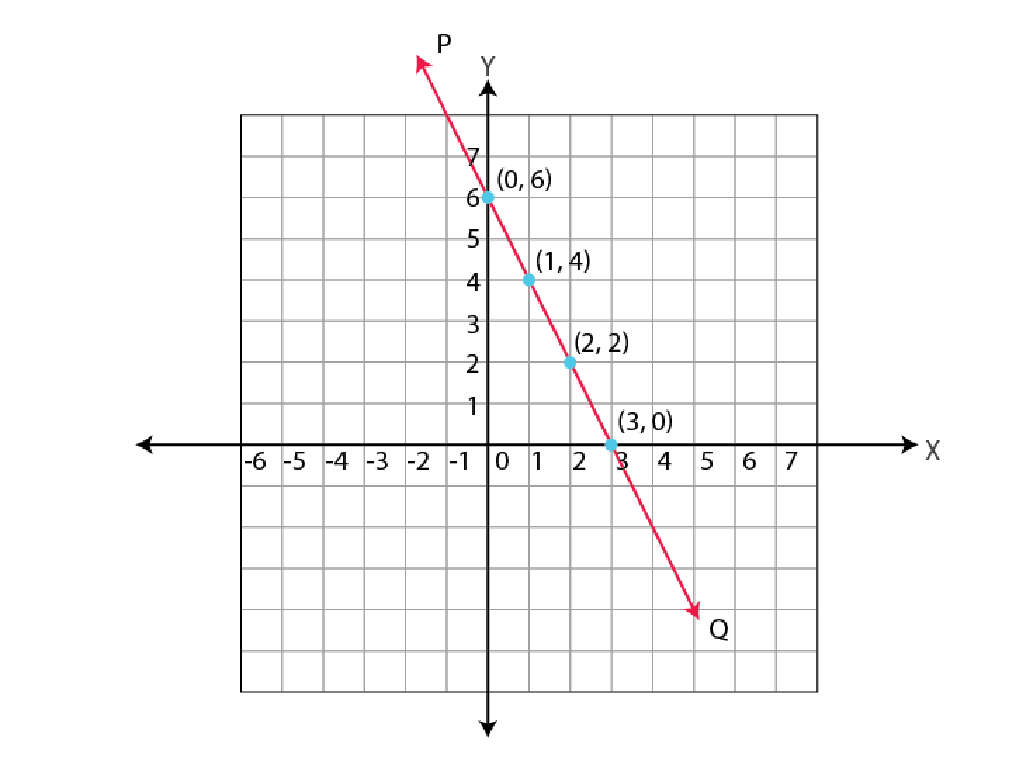
– Graphing slope visually
– Use a graph to see slope as a line’s angle
– Slope’s role in rate of change
– Slope shows how quickly y changes with x
|
This slide introduces the concept of slope, which is a fundamental idea in algebra and represents the steepness of a line on a graph. The formula for slope, m = Rise/Run, is crucial for students to understand as it quantifies the rate at which y-values change relative to x-values. A visual representation on a graph will help students see how slope can be determined by the angle of the line. Emphasize that slope is a measure of the rate of change and is used to describe how one variable changes in relation to another in various real-world situations. Provide examples of positive, negative, zero, and undefined slopes to illustrate different types of rate of change.
Exploring Rate of Change
– Rate of Change measures quantity over time
– It’s akin to slope in various contexts
– Example: Speed of a car
– If a car travels 60 miles in 2 hours, the rate is 30 mph
– Example: Growth of a plant
– A plant grows 5 cm in a week, the rate is 5 cm/week
|
The concept of Rate of Change is crucial for understanding how different quantities are related over time. It’s a foundational idea in algebra that connects to the concept of slope, which students have already explored. By comparing it to slope, students can use their prior knowledge to grasp this new concept. Use everyday examples like the speed of a car (distance over time) or the growth of a plant (height over time) to illustrate how rate of change is present in real life. Encourage students to think of other examples where they can observe rate of change. This will help them understand the practical applications of what they’re learning in math class.
Rate of Change in Tables
– Identifying rate of change
– Look at the table and compare the changes in values
– Calculate y-value differences
– Find the change in the output (vertical) values
– Calculate x-value differences
– Find the change in the input (horizontal) values
– Practice with a simple table
– Use a table to calculate the rate of change step by step
|
This slide introduces the concept of rate of change as it applies to tables of values, a key concept in understanding slope in algebra. Start by explaining how to identify the rate of change by comparing the differences in y-values (output) and x-values (input) in a given table. Emphasize that the rate of change is a measure of how one quantity changes in relation to another. Provide a simple table with values for students to practice calculating the rate of change, ensuring they understand how to divide the difference in y-values by the difference in x-values. This exercise will help solidify their understanding of the concept and prepare them for more complex problems.
Rate of Change in Everyday Life
– Understanding rate of change
– Heart rate monitoring example
– E.g., heart rate increases with intensity
– Relating to real-world scenarios
– E.g., speed of a car or growth of a plant
– Significance of rate of change
– Helps in predicting and understanding patterns
|
This slide aims to help students connect the mathematical concept of rate of change to everyday situations, enhancing their understanding and retention. By monitoring heart rate during exercise, students can see how the rate increases with physical activity intensity, which is a practical example of rate of change. Other relatable scenarios include the speed of a car or the growth of a plant over time. Emphasize the importance of understanding rate of change as it allows us to predict and comprehend various patterns in real-world contexts. Encourage students to think of additional examples and discuss how rate of change applies to them.
Class Activity: Calculating Rate of Change
– Understand rate of change
– Analyze given tables
– Look at the tables and identify changing quantities
– Calculate rate of change in pairs
– Use the formula (change in y) / (change in x)
– Discuss findings with class
|
This activity is designed to reinforce the concept of rate of change by having students work collaboratively. Provide each pair with a table depicting different scenarios, such as distances over time or prices over years. Guide them to calculate the rate of change by finding the difference in the dependent variable (y) and dividing it by the difference in the independent variable (x). After calculations, facilitate a discussion where pairs share their results and methods. This will help students understand the concept of slope as a rate of change and how it applies to various contexts. Possible activities: 1) Distance traveled over time, 2) Water level decrease in a tank, 3) Temperature change over hours, 4) Savings account growth over months, 5) Plant growth over weeks.
Practice Problems: Rate of Change
– Solve individual rate of change problems
– Use the learned formula and methods
– Remember: Rate of change = (change in value) / (change in time)
– Document your solution process
– Write down each step you take to solve the problems
– Share your methods in the next class
– Be ready to explain how you found your answers
|
This slide is aimed at reinforcing the students’ understanding of the rate of change through individual practice. Provide a variety of problems that require students to calculate the rate of change using the formula (change in value) / (change in time). Encourage them to document their solution process step by step, which will help them to understand their methods and make it easier to share with the class. In the next session, create an interactive environment where students can discuss different approaches and solutions, fostering a collaborative learning experience.
Review and Reflect: Slope and Rate of Change
– Recap on slope and rate of change
Slope represents the steepness of a line, and rate of change shows how one quantity changes in relation to another.
– Applying knowledge to problem-solving
Use slope to predict future events or understand patterns in tables and graphs.
– Open floor for questions
– Clarify any doubts
|
This slide aims to consolidate the students’ understanding of slope and rate of change. Begin by reviewing the concepts, emphasizing that slope is the ratio of the vertical change to the horizontal change between two points on a line. Discuss how this concept is used to determine how quickly or slowly things change. Encourage students to think of real-world problems where this knowledge is applicable, such as calculating speed or growth rates. Open the floor for questions to address any uncertainties and offer clarifications. This interactive session will help ensure that students are comfortable with the material and ready to apply it in various contexts.
Homework: Exploring Rate of Change
– Complete the rate of change worksheet
– Find real-life rate of change examples
– Examples: speed of a car, growing plant height
– Note down your findings
– Write what clues helped you understand
– Discuss in the next class
|
This homework assignment is designed to reinforce the concept of rate of change that students learned in class. The worksheet will provide structured practice on calculating rate of change from tables. Encourage students to observe the world around them to find examples of rate of change, such as the speed of a car (distance over time) or the growth of a plant (height over time). They should note down how they identified the rate of change and be prepared to discuss their examples in the next class. This will help them connect mathematical concepts to real-world situations, enhancing their understanding and retention.
Wrapping Up: Rate of Change
– Excellent work in today’s lesson!
– Practice is key to mastery
– Anticipate our next session
– Keep exploring rate of change
– Try creating your own tables to practice
|
As we close today’s lesson on the rate of change, it’s important to acknowledge the students’ efforts and encourage them to continue practicing. Mastery in understanding the concept of slope and rate of change comes with consistent practice. Remind them to review their notes, complete any assigned homework, and try creating their own tables to apply what they’ve learned. Looking forward to seeing the students in the next class, where we will continue to build on these foundational concepts. Keep the enthusiasm high and the curiosity alive!
