


Rate Of Change: Graphs
Subject: Math
Grade: Seventh grade
Topic: Slope
Please LOG IN to download the presentation. Access is available to registered users only.
View More Content


Slope and Rate of Change in Daily Life
– Understanding daily life slope
– Slope is steepness, like a wheelchair ramp
– Defining rate of change
– Rate of change measures how one quantity changes in relation to another
– Relating slope and rate of change
– Slope is the rate of change in the context of graphs
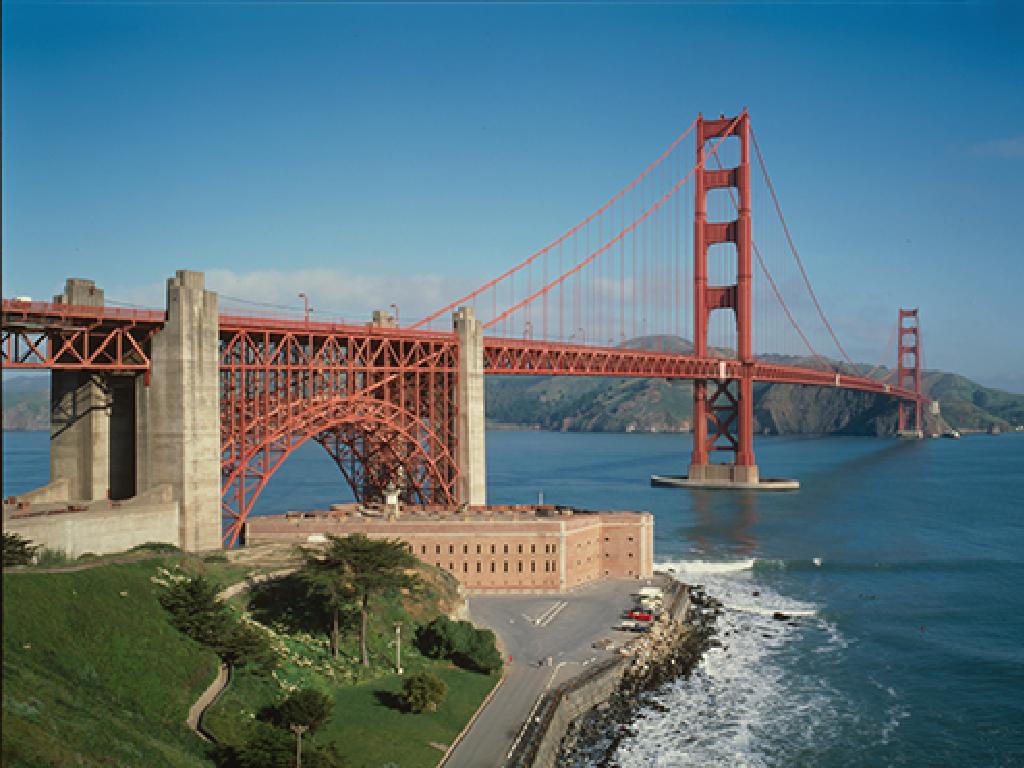
– Examples of slope in real scenarios
– Think of a hill’s incline or stairs
|
This slide introduces the concept of slope and rate of change, grounding it in everyday experiences to make it more relatable for seventh graders. Begin by discussing the slope as a measure of steepness, such as the incline of a ramp or hill, which they see and experience regularly. Explain that rate of change is a mathematical way to describe how one thing changes in relation to something else, like speed over time. Connect these ideas by showing how slope represents the rate of change on a graph, with steeper slopes indicating a greater rate of change. Use real-life examples like the steepness of a hill to illustrate these concepts. Encourage students to think of other examples where they encounter slope or rate of change in their daily lives.
Understanding Slope in Graphs
– Slope: Measure of steepness
– Slope indicates how a line tilts; rise over run
– Slope Formula: (y2 – y1) / (x2 – x1)
– Calculate change in y over change in x
– Types of Slope: 4 main types
– Positive, Negative, Zero, Undefined
– Slope in real-life scenarios
– E.g., Positive slope: hiking uphill
|
The concept of slope is fundamental in understanding how graphs represent change. Slope is the ratio of the vertical change (rise) to the horizontal change (run) between two points on a line. The slope formula is a practical tool for calculating this ratio. There are four main types of slope: positive indicates an upward trend, negative indicates a downward trend, zero indicates a constant trend, and undefined indicates a vertical line with no horizontal change. Relate the types of slope to real-life situations, such as climbing a hill or descending, to help students visualize and grasp the concept. Encourage students to practice calculating slope using the formula with various pairs of points to solidify their understanding.
Graphing Slope: Understanding Rate of Change
– Plot points on a coordinate graph
– Use an ordered pair (x, y) to plot each point.
– Draw a straight line through points
– Connect the dots with a ruler for accuracy.
– Determine the slope from a graph
– Slope equals rise over run between two points.
– Slope as a rate of change
|
This slide introduces students to the concept of slope as it relates to the rate of change on a graph. Begin by explaining how to plot points using their x (horizontal) and y (vertical) coordinates. Emphasize the importance of precision when drawing lines through these points. Clarify that the slope represents the steepness of the line and can be calculated by the ‘rise over run’ method, which is the vertical change divided by the horizontal change between two points on the line. Understanding slope is crucial for interpreting and creating graphs that represent real-world situations, such as speed or growth over time. Provide examples and practice problems to reinforce these concepts.
Exploring Rate of Change
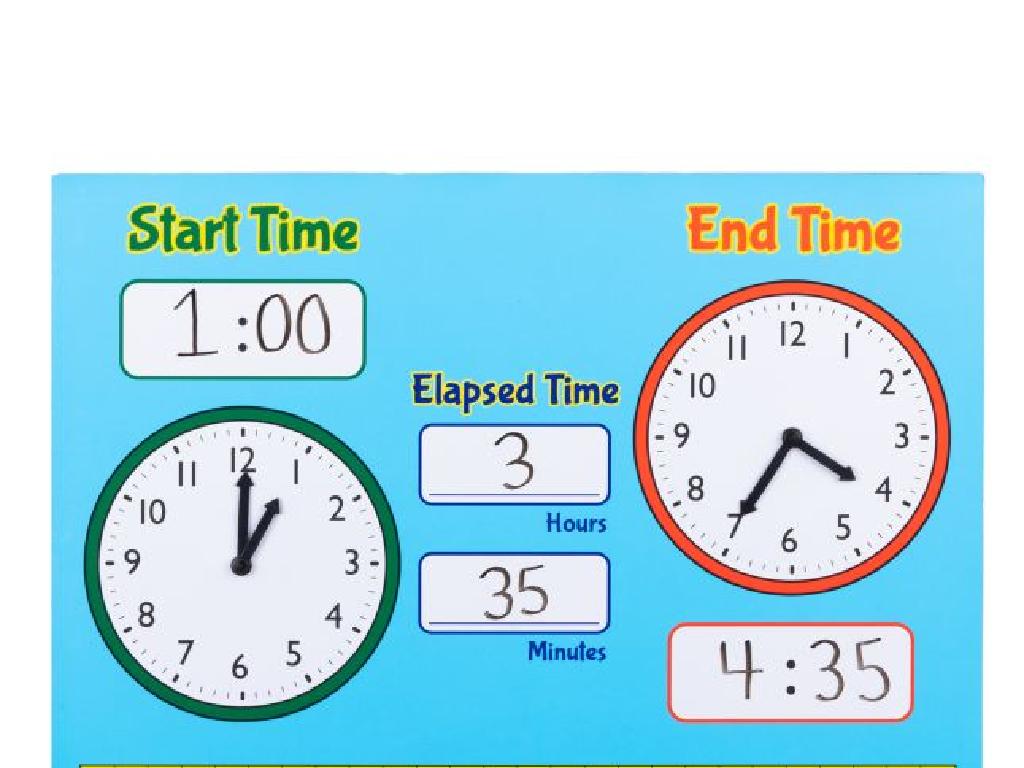
– Understanding rate of change
– It’s the speed at which a variable changes over a specific time.
– Rate of change in daily life
– Examples: speed of a car, growth of a plant.
– Calculating from tables
– Divide the change in the value of the variable by the change in time.
– Graphs and slope connection
– Slope of a line on a graph represents the rate of change.
|
This slide introduces the concept of rate of change, which is a fundamental idea in understanding how variables interact over time. Start by explaining that rate of change is essentially how quickly something changes, like speed or growth. Provide relatable examples such as the speed of a car (distance over time) or the growth of a plant (height over time). Then, show how to calculate the rate of change using a table of values by dividing the change in the variable by the change in time. Finally, connect this concept to the slope of a line on a graph, which visually represents the rate of change. Encourage students to think of other examples where they encounter rates of change in their daily lives.
Slope and Rate of Change in Graphs
– Identify rate of change on graphs
– Look at the rise over run between two points
– Compare graphs’ rates of change
– See which line rises faster over the same run
– Understand line steepness
– Steeper lines mean a greater rate of change
– Relate steepness to rate of change
– A steeper slope indicates a larger rate of change
|
This slide introduces the concept of slope as the rate of change in graphs. Students should learn how to identify the rate of change by calculating the ‘rise over run’ between two points on a line. Encourage them to compare different graphs to see which has a steeper slope, indicating a faster rate of change. Understanding the steepness of a line helps in interpreting the rate at which values increase or decrease. Use examples like speed versus time graphs to illustrate how a steeper line means faster acceleration. Activities can include graphing different lines and comparing their slopes, or interpreting real-world scenarios through graph analysis.
Exploring Slope and Rate of Change
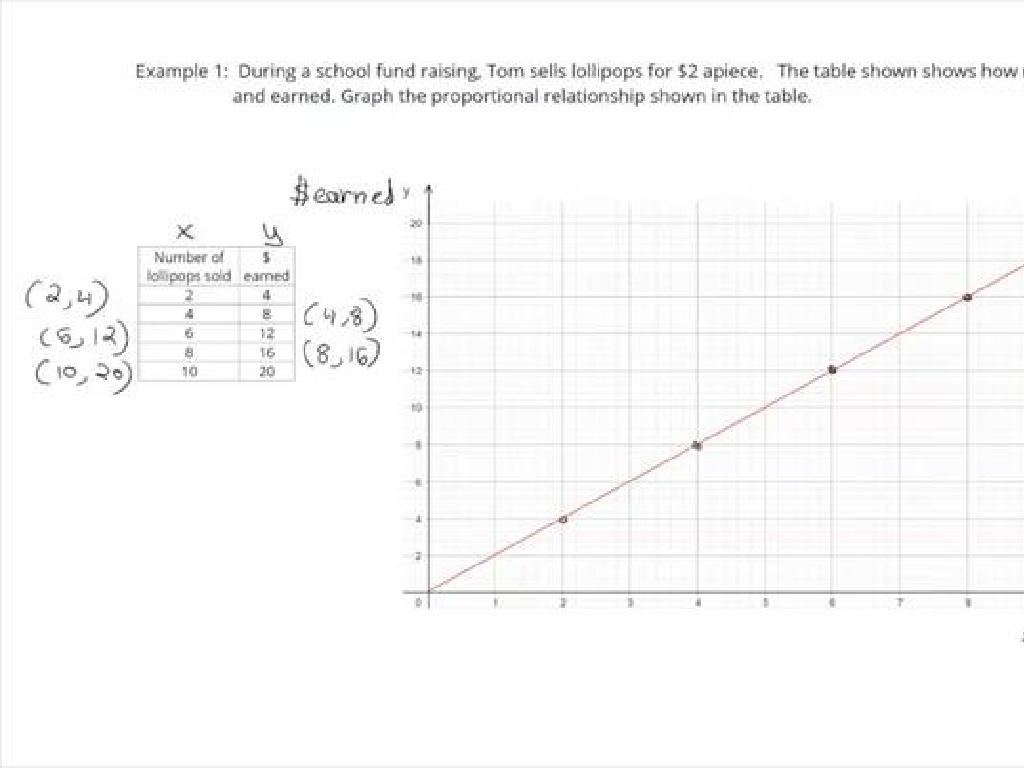
– Find slope from a graph example
– Slope is rise over run between two points on a line
– Calculate rate of change example
– Rate of change is the slope of a line representing data
– Class practice on slope identification
– Class practice on rate of change
|
Begin with a worked example showing how to find the slope from a graph, emphasizing the ‘rise over run’ method between two points. Follow with another example, this time calculating the rate of change, which is essentially the slope of a line on a graph that represents data over time. For class practice, provide students with multiple graphs to identify the slope and rate of change. Encourage them to work in pairs or groups to discuss their findings. Offer guidance as needed and ensure to clarify that while slope is a general term in mathematics, rate of change applies it to real-world scenarios. Possible activities include comparing slopes of different lines, interpreting what a steeper or flatter slope means in context, and relating the concepts to everyday situations like speed or growth over time.
Class Activity: Exploring Slope and Rate of Change
– Understand measuring slope
– Gather rulers, graph paper, markers
– Group task: graph creation
– Work together to plot points and draw a line
– Calculate the slope of your graph
– Use the formula (rise/run) to find the slope
|
This activity is designed to provide hands-on experience with the concept of slope as the rate of change on a graph. Students will use rulers to measure the rise and run on graph paper and markers to plot points and draw lines. In groups, they will create their own graphs and use the slope formula to calculate the slope of the line they’ve drawn. This will help them visualize and understand how slope represents the rate of change. Possible variations for different groups could include using different scales on the graph paper, comparing slopes of different lines, or incorporating real-world data into their graphs. The teacher should circulate to provide guidance and ensure that each group understands the slope calculation process.
Understanding Slope: Recap and Homework
– Recap: Slope as rate of change
– Slope’s role in math and life
– Slope predicts trends in economics, physics, etc.
– Homework: Practice problems
– Solve for slope in different scenarios
– Emphasize real-life application
– Relate slope to everyday situations
|
This slide aims to consolidate the students’ understanding of slope as the rate of change and its significance both in mathematical concepts and real-world applications. Emphasize the importance of slope in various fields such as economics, where it can represent growth trends, or in physics, where it can describe acceleration. For homework, assign problems that require students to calculate the slope from graphs and data points, ensuring they practice and apply what they’ve learned. Encourage them to think about how slope appears in everyday life, such as in road inclines or in comparing different rates, to reinforce the concept’s relevance.
