


Identify Shortage And Surplus With Graphs
Subject: Social studies
Grade: Fourth grade
Topic: Supply And Demand
Please LOG IN to download the presentation. Access is available to registered users only.
View More Content
Understanding Shortage and Surplus
– Basics of buying and selling
– Supply and demand influence
– How what we want and what’s available affects what we get
– Exploring shortage
– When demand is high but supply is low, we have a shortage
– Discovering surplus
– When supply is high but demand is low, we have a surplus
|
This slide introduces the fundamental concepts of supply and demand, focusing on how they create shortages and surpluses in the market. Begin by explaining the basic idea of buying and selling, where money is exchanged for goods or services. Highlight how supply (how much of something is available) and demand (how much of something people want) affect our everyday choices, such as what we buy and at what price. Use simple, relatable examples to illustrate shortage and surplus. For shortage, you might use the example of a popular toy during the holiday season when demand exceeds supply. For surplus, consider a lemonade stand on a cold day when there’s more lemonade than buyers. Encourage students to think of their own examples and understand how these concepts affect their lives.
Understanding Supply and Demand
– What is supply?
– Supply is how much of something is available.
– What is demand?
– Demand is how much people want of that thing.
– Finding the balance
– Balance is when supply equals demand.
– Effects of shortage and surplus
– Shortage: not enough supply for demand. Surplus: more supply than demand.
|
This slide introduces the basic concepts of supply and demand, which are foundational to understanding economics. Supply refers to the amount of a product or service that is available to consumers, while demand is the desire of consumers to purchase a product or service. The balance between supply and demand determines the market price and availability of goods. A shortage occurs when demand exceeds supply, often leading to increased prices. A surplus happens when supply exceeds demand, which can result in lower prices. Use graphs to visually show the relationship between supply and demand, and how they affect prices. Encourage students to think of examples, such as their favorite toys or snacks, to relate these concepts to their everyday lives.
Exploring Shortage in Supply and Demand
– Understanding shortage
– Shortage means less supply than demand
– Effects of a shortage
– Prices may rise, and people might wait in lines
– Real-life shortage example
– A hot toy during Christmas may sell out quickly
– Graphing shortage on a graph
|
This slide introduces the concept of shortage within the context of supply and demand. Begin by explaining that a shortage occurs when there’s not enough of a product that many people want to buy. Discuss the consequences of a shortage, such as increased prices and long waits for the product. Use a relatable example, such as a popular toy during the holiday season that sells out fast, to illustrate the concept. Show students how to represent a shortage on a graph, with the demand line above the supply line, indicating that more people want the product than is available. Encourage students to think of other examples of shortages they may have experienced or heard about.
Understanding Surplus in Supply and Demand
– Surplus means too much supply
– When there’s more of an item than people want to buy
– Effects of a surplus
– Prices may drop to sell extra items
– Halloween costumes post-Halloween
– Stores have many costumes left after Oct 31st
– Graphs show surplus visually
|
This slide introduces the concept of surplus within the context of supply and demand. A surplus occurs when there is more of a product available than what people are willing to buy. Discuss the implications of a surplus, such as potential price reductions to encourage sales. Use the relatable example of unsold Halloween costumes after the holiday to illustrate a real-life surplus situation. Explain how graphs can help us visualize surplus by showing the quantity of goods that remain unsold at various prices. Encourage students to think of other examples of surplus and how it might affect their decisions as consumers.
Reading Supply & Demand Graphs
– Learn to read supply/demand graphs
– Graphs show where supply meets demand
– Find shortage and surplus points
– Shortage: high demand, low supply. Surplus: low demand, high supply
– Explore the price effect
– Prices change when there’s a shortage or surplus
– Understand market balance
– Equilibrium is when quantity supplied equals quantity demanded
|
This slide introduces students to the basics of reading supply and demand graphs, a key concept in understanding economics. Students will learn to identify points where there is a shortage (demand is greater than supply) and surplus (supply is greater than demand) and how these points affect prices. Emphasize that a shortage often leads to higher prices, while a surplus may cause prices to drop. The concept of market equilibrium, where the quantity supplied equals the quantity demanded, is also introduced. Use simple, relatable examples, such as lemonade stands or toy sales, to illustrate these points. Encourage students to think about how changes in supply or demand for their favorite products might affect prices.
Shortage and Surplus in Graphs
– What is a shortage in markets?
– When demand is greater than supply, causing a shortage.
– What is a surplus in markets?
– When supply exceeds demand, creating a surplus.
– Reading graphs for shortage and surplus
– Look for where the demand line is above supply for shortage, and below for surplus.
– Graphs and market understanding
|
This slide aims to help students visualize and understand the concepts of shortage and surplus using graphs. A shortage occurs when the demand for a product is higher than the supply available, often leading to empty shelves or long waiting lists. A surplus, on the other hand, happens when there’s more of a product available than people want to buy, which can result in unsold items. By using simple graphs, we can see these market conditions clearly. The demand curve shows how much people want to buy at different prices, and the supply curve shows how much is available. Where these two lines intersect is the market equilibrium. If the demand line is above the supply line, it indicates a shortage. If it’s below, it indicates a surplus. Understanding these concepts through graphs helps students grasp how real-world markets operate.
Let’s Practice: Shortage & Surplus
– Understand shortage and surplus
– Shortage: demand > supply. Surplus: supply > demand.
– Group activity: graph creation
– Use paper to draw supply & demand graphs.
– Analyze different scenarios
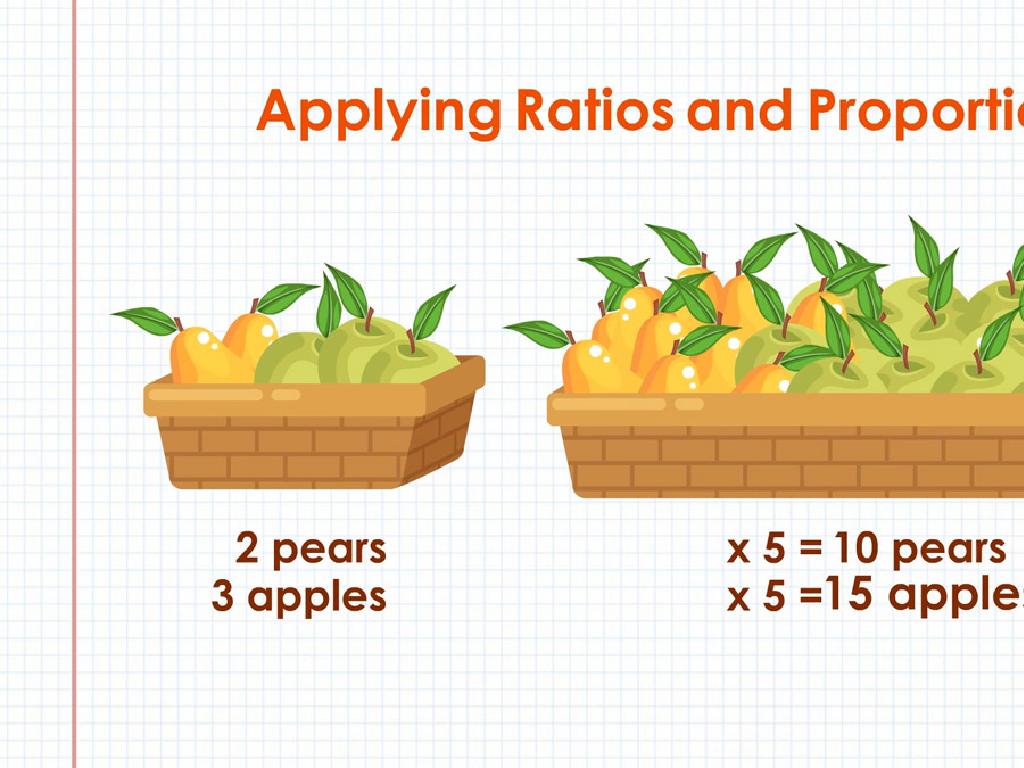
– Look at examples like toys or fruits.
– Share findings with the class
– Discuss what you learned about graphs.
|
This slide is for a class activity focused on identifying shortage and surplus using graphs. Begin by explaining the concepts of shortage (when demand is greater than supply) and surplus (when supply exceeds demand). Divide the class into small groups and provide them with paper and markers to create their own supply and demand graphs based on different scenarios, such as the availability of toys or seasonal fruits. After the activity, each group will present their graphs and explain their findings to the rest of the class. This will help students understand how to interpret real-world economic situations. The teacher should circulate to provide guidance and ensure that each group understands the concepts. Possible variations of the activity could include using different products, changing market conditions, or even simulating a market in the classroom.
Class Activity: Market Simulation
– Simulate a market in class
– Experience shortage and surplus
– Some students will have more items, others fewer, showing surplus and shortage.
– Observe supply and demand effects
– Notice how having more or less product affects the ‘price’ and ‘demand’.
– Discuss our findings
|
This activity is designed to give students a practical understanding of supply and demand, and how these concepts create shortages and surpluses in a market. Set up a mock market in the classroom where students can ‘buy’ and ‘sell’ items. Some students will have excess items (surplus), while others will not have enough (shortage). Observe how students negotiate prices based on their supply or demand. After the activity, lead a discussion on how supply and demand affected their experience during the simulation. Ask them to relate their observations to real-life scenarios. Possible activities: 1) Fruit market simulation, 2) Classroom stationery trade, 3) ‘Selling’ classroom chores, 4) Book exchange market, 5) Snack bar simulation.
Wrapping Up: Shortage, Surplus, and Supply & Demand
– Recap: What’s a Shortage?
– When demand is greater than supply, we have a shortage.
– Recap: What’s a Surplus?
– When supply exceeds demand, we have a surplus.
– Why Supply & Demand Matters
– It helps us understand market dynamics and make smart choices.
– Q&A Time!
|
As we conclude today’s lesson, let’s review the key concepts. A shortage occurs when there are not enough goods for the people who want to buy them, often leading to higher prices. On the other hand, a surplus happens when there’s more of an item than people want to buy, which can cause prices to drop. Understanding supply and demand is crucial because it affects everyday decisions, like how much to charge for a product or how much of it to produce. Now, let’s open the floor for any questions the students might have. This is an opportunity to clarify doubts and reinforce learning. Encourage students to ask questions about shortages, surpluses, or any part of the supply and demand topic we’ve covered.
