


Identify Shortage And Surplus With Graphs
Subject: Social studies
Grade: Fifth grade
Topic: Supply And Demand
Please LOG IN to download the presentation. Access is available to registered users only.
View More Content

Understanding Shortage and Surplus
– Basics of Supply and Demand
– Supply is how much is available, demand is how much people want.
– Making buying and selling decisions
– We choose based on what we need and what’s available.
– What is a Shortage?
– When demand is greater than supply, we have a shortage.
– What is a Surplus?
– When supply exceeds demand, we have a surplus.
|
This slide introduces the fundamental concepts of supply and demand, which are crucial for understanding how markets work. Explain that supply represents the quantity of goods available for sale, while demand is the quantity that consumers are willing and able to purchase. Discuss how decisions to buy and sell are influenced by personal needs, availability, and price. Focus on the concepts of shortage and surplus: a shortage occurs when there aren’t enough goods for the people who want to buy them, often leading to increased prices; a surplus happens when there’s more of a good than people want to buy, which can lead to decreased prices. Use relatable examples, such as a popular toy running out before every child can buy one (shortage), or a lemonade stand making more lemonade than it can sell on a cold day (surplus).
Understanding Supply and Demand
– What is supply?
– Supply is how much of something is available.
– What is demand?
– Demand is how much people want of that thing.
– Balance affects prices
– If supply and demand are balanced, prices tend to be stable.
– Graphs show shortage & surplus
– Graphs help us visualize when there is too much or too little of an item.
|
This slide introduces the basic concepts of supply and demand, which are fundamental to understanding economics. Supply refers to the amount of a product or service that is available for purchase, while demand refers to the desire of buyers for that product or service. When supply and demand are in balance, prices generally remain stable. However, when there is an imbalance, it can lead to a surplus (too much supply, not enough demand) or a shortage (too much demand, not enough supply). Graphs are a useful tool for illustrating these concepts, showing the relationship between the amount of goods available and the desire for them. Encourage students to think of examples, such as their favorite toys or snacks, and how popularity (demand) can affect how easy or hard they are to find (supply).
Exploring Shortage in Supply and Demand
– Shortage: Demand exceeds supply
– When people want more of a product than is available
– Effects of a shortage
– Think about a time when a favorite snack was all gone from the store
– Real-world example: Holiday toy
– Like when a hot new toy sells out quickly and is hard to find
|
This slide introduces the concept of shortage within the context of supply and demand. A shortage occurs when the demand for a product is higher than the supply available. It’s important for students to understand that this can lead to items being out of stock and can affect consumer behavior. Use the example of a popular new toy during the holiday season to illustrate how a high demand can lead to a shortage, making the toy difficult to purchase. Discuss with students other examples they may have experienced or heard about. Encourage them to think about how shortages might affect their choices as consumers.
Exploring Surplus in Supply and Demand
– Surplus: Supply exceeds demand
– Effects of surplus in markets
– When there’s too much, items may go unsold, leading to waste or lower prices.
– Real-world surplus example
– Imagine a store full of Halloween costumes that no one buys after October 31st.
– Understanding surplus with graphs
– Graphs show surplus when the supply line is above the demand line.
|
This slide introduces the concept of surplus within the context of supply and demand. A surplus occurs when the amount of a product that is available is greater than the amount that consumers want to buy. Discuss the implications of surplus, such as potential waste or the need for stores to lower prices to sell excess items. Use the example of unsold Halloween costumes to illustrate how seasonal items can lead to surplus situations. Show a simple graph where the supply curve is higher than the demand curve to visually represent surplus. Encourage students to think of other examples and how surplus might affect their decisions as consumers.
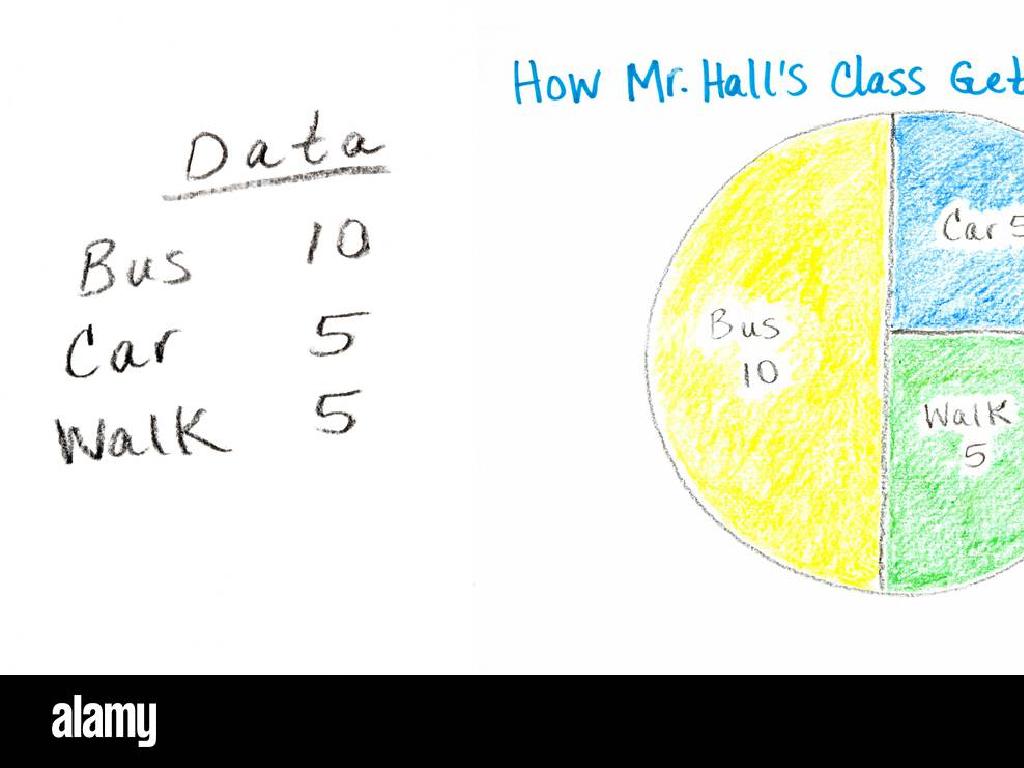
Reading Graphs: Shortage & Surplus
– Graphs visualize market balance
– Graphs turn numbers into pictures for easy understanding
– Intersection points show market status
– The point where supply and demand curves meet is called equilibrium
– Curve positions indicate shortage/surplus
– If demand is higher than supply, it’s a shortage. If supply is higher, it’s a surplus.
– Understanding economic equilibrium
– Equilibrium is when the amount supplied equals the amount demanded
|
This slide aims to help students grasp how graphs can illustrate concepts of shortage and surplus in a market. Begin by explaining that graphs can make complex data easier to understand by turning them into visual representations. Show how the intersection of supply and demand curves represents the market equilibrium, where the quantity supplied equals the quantity demanded. Then, discuss how a shift in these curves can lead to a shortage (high demand, low supply) or a surplus (low demand, high supply). Use simple, relatable examples like a lemonade stand to demonstrate these concepts. Encourage students to think of questions about how different scenarios might affect the balance between supply and demand.
Graphing Supply & Demand: Shortage vs. Surplus
– Create supply & demand graphs
– Use everyday items as examples
– Think of pencils, toys, or fruits
– Determine shortage or surplus
– Is the item in high demand but low supply (shortage) or low demand and high supply (surplus)?
– Understand market balance
|
This slide introduces a class activity where students will apply their knowledge of supply and demand by creating graphs using examples of everyday items. The goal is for students to visually understand how the availability of an item (supply) and the desire for that item (demand) can lead to a shortage or surplus. A shortage occurs when demand exceeds supply, leading to not enough items for everyone who wants them. A surplus happens when supply exceeds demand, resulting in too many items left over. Teachers should prepare graph paper and example items for students to graph. Possible activities include graphing the supply and demand of seasonal fruits, school supplies during back-to-school season, or popular toys during holiday seasons. Encourage students to discuss why an item might be in shortage or surplus and what factors could change the supply or demand of that item.
Real-Life Scenarios: Shortage & Surplus
– Effects of shortage on choices
– Shortage may lead to choosing alternatives
– Your actions during surplus
– Might save or share extra items in surplus
– Discuss real-life examples
– Example: shortage of water or surplus of toys
– Group discussion activity
|
This slide aims to engage students in understanding the concepts of shortage and surplus through relatable scenarios. Begin by explaining how a shortage of goods, like a popular toy before the holidays, can affect what choices we make, such as settling for a different toy or paying a higher price. Conversely, discuss how a surplus, like an abundant harvest of apples, might lead us to save more or share with others. Use real-life examples to illustrate these points, and then break the class into groups to discuss similar scenarios they might have experienced or observed. This activity will help students apply the concepts of supply and demand to everyday life and understand the impact on decision-making.
Class Activity: Market Simulation
– Understand market concepts
– Classroom transforms into a market
– We’ll create a market setup with different ‘shops’ around the room.
– Students decide on product prices
– Using fake currency, price your items as a shopkeeper based on how many you have and how much people want them.
– Observe supply and demand effects
– Watch how prices change when there are too many or too few items.
|
This activity is designed to help students apply their knowledge of supply and demand by simulating a market environment. Set up ‘shops’ in the classroom with various items (could be school supplies, snacks, etc.). Assign some students to be shopkeepers and others to be customers. Provide shopkeepers with a certain amount of stock and give customers a budget with fake currency. Shopkeepers will set prices based on their understanding of supply and demand, and customers will purchase items based on their needs and wants. Observe and discuss how shortages and surpluses affect prices. Possible variations of the activity could include introducing unexpected changes in supply or demand, such as a sudden increase in the popularity of an item or a new shipment arriving.
Conclusion: Shortage, Surplus, and Supply & Demand
– Key points on shortage and surplus
– Shortage occurs when demand exceeds supply; surplus when supply exceeds demand.
– Supply and demand’s role in markets
– Understanding this helps predict product availability and pricing.
– Reflect on today’s learning
– Share a memorable lesson takeaway
|
As we wrap up today’s lesson, we reflect on the concepts of shortage and surplus and how they relate to supply and demand. Shortage happens when there aren’t enough goods for the people who want to buy them, leading to empty shelves or long waits. Surplus is the opposite, where there’s more of a product than people want to buy, which can lead to sales or wasted products. Understanding these concepts helps us make sense of why products are priced a certain way and why they might be hard to find sometimes. Encourage students to think about a situation where they experienced a shortage or surplus and share one thing from today’s lesson that stood out to them. This reflection helps solidify their understanding and allows them to apply the concepts to real-life scenarios.
