Interpret A Graph: Word Problems
Subject: Math
Grade: Seventh grade
Topic: Two-Variable Equations
Please LOG IN to download the presentation. Access is available to registered users only.
View More Content
Graphs and Equations: Interpreting Word Problems
– Learn the language of graphs
– Understand terms like axes, scales, and coordinates.
– Graphs narrate numerical stories
– See how data creates a visual story over time or categories.
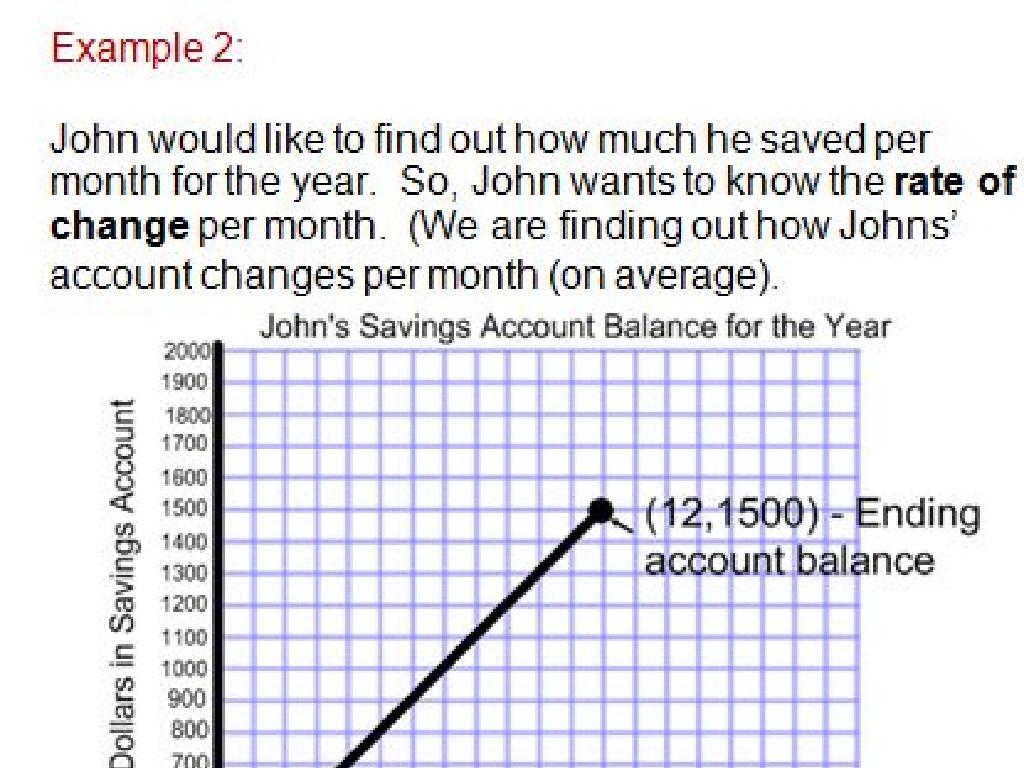
– Interpreting graphs for word problems
– Use graph details to solve problems described in words.
– Practice with real-world examples
– Apply these skills to situations like budgeting or tracking progress.
|
This slide introduces students to the concept of using graphs to solve word problems, an essential skill in math and real life. Start by familiarizing them with graph terminology and the importance of understanding the axes and scales. Explain how graphs can represent stories and trends with numbers, making complex data easier to digest. Emphasize the skill of interpreting these visual stories to answer questions or make predictions based on word problems. Provide examples that are relevant to their experiences, such as managing a weekly allowance or comparing test scores over time. Encourage students to practice by assigning problems that require them to extract information from graphs and apply it to solve real-world scenarios.
Understanding Two-Variable Equations
– Define two-variable equation
– An equation with two different variables, e.g., y = 2x + 3
– Examples of two-variable equations
– For instance, x + y = 10 or 2x – 3y = 6
– Two-variable equations in real life
– Budgeting, tracking scores, or measuring ingredients
– Solving word problems with graphs
– Use graphs to find solutions to real-world problems
|
This slide introduces students to the concept of two-variable equations, which are fundamental in algebra and represent relationships between two different quantities. Start by defining a two-variable equation and show simple examples like y = 2x + 3. Explain that these equations can model real-life situations, such as budgeting money or scoring in games. Emphasize the practicality by discussing how they can be used to make predictions and informed decisions. Finally, demonstrate how graphs of these equations can help solve word problems by visually representing the solutions. Encourage students to think of other areas where two-variable equations might be applied and to practice graphing them for a better understanding.
Interpreting Graphs: Key Components
– Identify X and Y axes
– X-axis is horizontal, Y-axis is vertical. They represent different variables.
– Understand scale and intervals
– Scale determines the value each grid represents; intervals are the divisions between values.
– Significance of the origin point
– Origin (0,0) is the starting point, where both variables have the value zero.
– Analyzing the graph’s meaning
|
This slide introduces students to the fundamental parts of a graph, which is crucial for solving word problems involving two-variable equations. Students should learn how to correctly identify the horizontal (X-axis) and vertical (Y-axis) axes, as well as what variables they represent in the context of the problem. Understanding the scale and intervals will help them accurately interpret the data points on the graph. The origin point is where both variables have the value of zero and is often the starting point for analyzing the relationship between the variables. Encourage students to practice by identifying these components on different types of graphs and to understand how each part contributes to the graph’s overall meaning.
Plotting Points on a Graph
– How to plot points with two variables
– Each point is defined by an X (horizontal) and Y (vertical) coordinate.
– Understanding coordinates (X, Y)
– Coordinates are written as (X, Y), where X is the position on the horizontal axis and Y is on the vertical.
– Practice example: plotting points
– Use the example (3, 4) to show how to plot on the graph.
– Interpreting points on the graph
– Discuss how the position of points helps us understand relationships between variables.
|
This slide introduces students to the basics of plotting points on a graph with two variables, which is a foundational skill in algebra and data analysis. Start by explaining the Cartesian coordinate system, where each point is determined by an X (horizontal) and Y (vertical) value. Provide a clear example, such as (3, 4), and demonstrate how to find the point on the graph. Have students practice with additional points to reinforce the concept. Emphasize the importance of correctly reading and plotting points as it leads to accurate interpretation of data and graphs. Encourage students to ask questions and provide several practice problems for them to plot points on their own.
Interpreting Graphs in Word Problems
– Significance of slope
– Slope indicates rate of change between variables
– Relationship between variables
– Variables may show direct or inverse correlation
– Graph analysis for problem-solving
– Use graph points to understand the story
– Example word problem
– E.g., Graph of a car’s journey, find distance after 3 hours
|
This slide introduces students to the concept of interpreting graphs within the context of word problems. The slope of a graph is a key element that indicates how one variable changes in relation to another. Understanding the relationship between variables is crucial; they can either increase together (direct correlation) or move in opposite directions (inverse correlation). Students should learn to analyze the graph by looking at specific points and using them to solve problems. For example, if a graph shows a car’s journey over time, students can use the slope to find out how far the car traveled after a certain number of hours. Encourage students to practice with different types of word problems to become proficient in interpreting various graphs.
Interpreting Graphs for Word Problems
– Read and understand the problem
– Grasp the main question and information given
– Translate words into a graph
– Convert the problem’s information into plotted points or lines on a graph
– Example: Graph word problem solution
– Use a graph to solve ‘Number of chores done over the week’
– Practice with different scenarios
|
This slide introduces students to the process of interpreting word problems with the help of graphs. Start by reading the problem carefully and identifying the key information. Next, show how to translate the textual data into graphical form, such as plotting points or drawing lines to represent relationships between variables. Walk through an example problem, such as calculating the total number of chores done over a week using a graph. Encourage students to practice with different types of word problems to become comfortable with translating words into graphical data. This will help them understand the practical application of graphs in solving real-world problems.
Graph Interpretation Challenge: Group Activity
– Solve graph-based word problems
– Share solutions with the class
– Explain how you arrived at your solution
– Discuss various problem-solving approaches
– Compare how each group tackled the problems
– Reflect on different answers and interpretations
– Understand that there can be multiple ways to interpret data
|
This class activity is designed to foster collaborative learning and critical thinking. Students will be divided into groups and given a set of word problems that require interpreting graphs. After solving the problems, each group will share their solutions and the thought process behind them. This will be followed by a class discussion on the different approaches used by each group. Encourage students to reflect on the fact that data can be interpreted in various ways and that understanding different perspectives is valuable. Possible activities could include interpreting sales data for a school fundraiser, analyzing temperature changes over a week, or comparing distances traveled by two different vehicles over time.
Graph Interpretation: Conclusion & Recap
– Recap of key lesson takeaways
– Understanding graphs is crucial for solving word problems involving two-variable equations.
– Significance of graph interpretation
– Graphs translate equations into visual formats, aiding in problem-solving and prediction.
– Homework assignment
– Complete the assigned problems to reinforce today’s concepts.
– Aim for mastery through practice
– Practice is essential to become proficient in interpreting graphs and solving related word problems.
|
As we conclude today’s lesson on interpreting graphs in the context of word problems, it’s important to review the key concepts we’ve covered. Understanding how to read and interpret graphs is a vital skill in mathematics and in many real-world applications. For homework, students are assigned practice problems that will help solidify their understanding of the lesson material. Encourage students to approach these problems methodically, using the strategies discussed in class. Remind them that mastery comes with practice, and these exercises are designed to build their confidence and skills in interpreting various types of graphs.


