Collect And Graph Temperature Data
Subject: Science
Grade: Fourth grade
Topic: Weather And Climate
Please LOG IN to download the presentation. Access is available to registered users only.
View More Content
Welcome to Weather and Climate!
– Understanding weather vs. climate
– Weather is day-to-day, climate is over long periods
– Exploring what temperature is
– Temperature measures how hot or cold
– Discovering why temperature matters
– Temperature affects our environment and daily activities
– How to measure and record temperature
– Using thermometers and creating temperature charts
|
This slide introduces the concepts of weather and climate, setting the stage for a deeper dive into the topic of temperature. Begin by explaining the difference between weather, which changes daily, and climate, which is the average weather over a long period. Discuss temperature as a key component of weather, describing how it measures the degree of hotness or coldness using a thermometer. Emphasize the importance of temperature in our lives, affecting everything from what we wear to the growth of plants. Conclude by explaining how students will learn to measure and graph temperature data, which is a fundamental skill in understanding weather patterns and climate change. Encourage students to think about how the temperature feels each day and how it might change throughout the year.
Exploring Weather Patterns
– Understanding daily weather
– Weather is the state of the atmosphere each day.
– Types of weather conditions
– Examples: Sunny, Rainy, Snowy, Windy.
– Weather changes over a week
– Weather can vary greatly, even in a short time.
– Recording weather data
|
This slide introduces the concept of weather as part of the larger topic of Weather and Climate. Begin by explaining that weather refers to the daily conditions of the atmosphere including temperature, humidity, precipitation, cloudiness, visibility, and wind. Provide examples of different weather conditions and engage the students by asking them to share what the weather is like outside today. Discuss how weather can change rapidly, using the example of how it can be sunny one day and rainy the next. Emphasize the importance of observing and recording these changes to understand patterns. As an activity, students could maintain a weather log for a week, noting the daily weather conditions and any changes observed. This will prepare them for the next step: graphing temperature data.
Understanding Climate
– Climate: average weather over years
– World’s various climates
– Examples: Tropical is warm, Desert is dry, Polar is cold, Temperate varies
– Climate vs. Weather
– Weather is day-to-day, climate is long-term pattern
– Impact on daily life
|
This slide introduces the concept of climate as a long-term average of weather patterns in a specific region, which is distinct from the day-to-day variations known as weather. Highlight the different types of climates found around the world, such as tropical, desert, polar, and temperate, and provide a brief description of each. Emphasize the difference between weather and climate to ensure students understand that weather can change in minutes, whereas climate is the general weather pattern over many years. Discuss how climate can affect the daily life of people, including the clothes they wear, the food they eat, and the activities they can do.
Exploring Temperature
– What is temperature?
– It tells us how hot or cold something is.
– Tools to measure temperature
– We use thermometers to find out the temperature.
– Units of temperature
– Degrees Celsius (°C) and Fahrenheit (°F) are used.
– Recording temperature data
– Keep a log of temperature readings over time.
|
This slide introduces the concept of temperature as part of the weather and climate unit. Explain that temperature is a measure of how hot or cold the air is, which is a basic concept in understanding weather patterns. Show the students a thermometer and demonstrate how it is used to measure temperature. Discuss the two scales of measurement, Celsius and Fahrenheit, and when each might be used. Encourage students to think about why it’s important to record temperature data, such as understanding climate change or preparing for the day. As an activity, students could start a temperature log, recording daily temperatures and graphing them at the end of a week or month to observe patterns.
Why Do We Measure Temperature?
– Understand weather patterns
– Predicting rain, sunshine, or snow helps us plan ahead
– Plan our daily activities
– Deciding what to wear or what to do based on the weather
– Help farmers protect crops
– Farmers use forecasts to prevent crop damage from extreme temps
– Importance in daily life
|
This slide aims to explain the practical reasons behind measuring temperature, emphasizing its relevance to everyday life and decision-making. By understanding weather patterns, we can predict conditions like rain or snow, which helps in planning activities and staying safe. Temperature also guides our daily choices, such as selecting appropriate clothing or the best time to engage in outdoor activities. For farmers, temperature data is crucial for protecting crops against potential damage due to frost or excessive heat. Discuss with students how they have experienced the impact of temperature in their lives, such as dressing up for cold weather or staying indoors during a hot day. Encourage them to think about how temperature affects not just humans but also plants and animals.
Collecting Temperature Data
– Scientists track temperature over time
– They observe patterns and changes in the environment.
– Record temps at various times in a day
– Morning, noon, and night – see how it changes!
– Learn to collect and record data
– We’ll use thermometers and data sheets for this activity.
– Understanding temperature patterns
|
This slide introduces the concept of collecting temperature data, a key aspect of studying weather and climate. Explain to students that scientists gather temperature data to understand weather patterns and climate changes. Show them how to use a thermometer and record the temperature at different times throughout the day, such as in the morning, at noon, and in the evening. Emphasize the importance of consistent data collection for accurate analysis. The activity will involve students using thermometers to measure and record the temperature at specified intervals. Encourage them to predict temperature changes and compare their data over time to understand daily temperature patterns.
Graphing Temperature Data
– Why we use graphs
– Graphs make it easier to see data patterns and trends.
– Creating a line graph
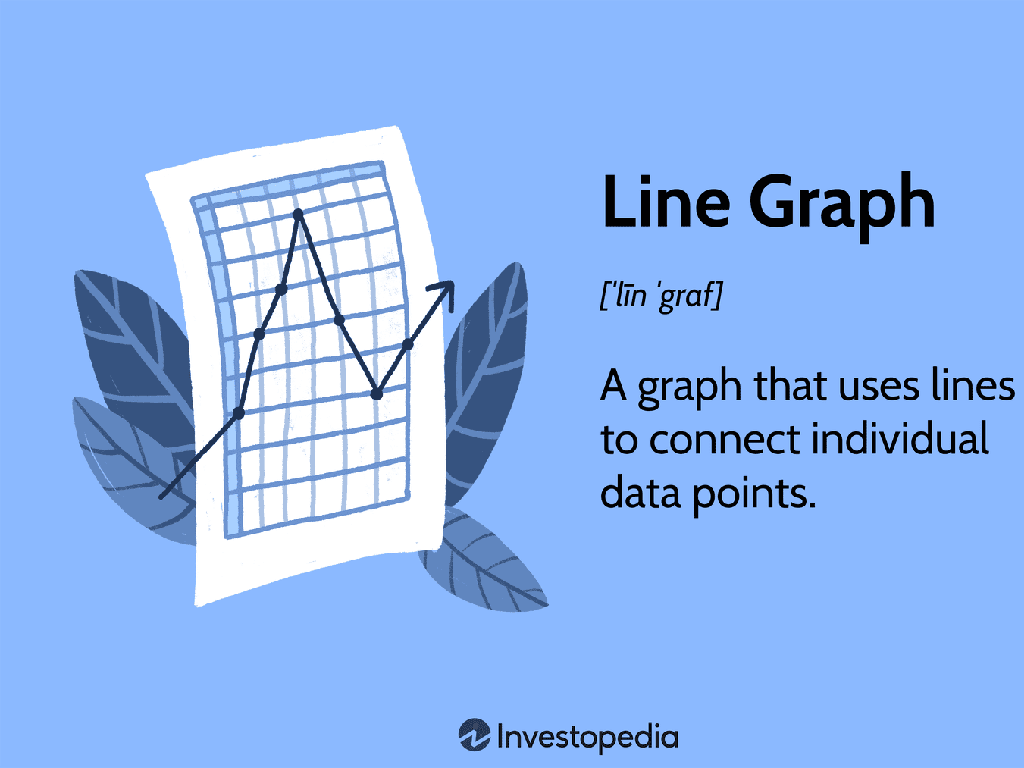
– We’ll use a line graph to show temperature changes over time.
– Plotting temperature points
– Each graph point shows the temperature at a certain time.
– Observing temperature patterns
– Look for patterns: Does it get warmer or cooler throughout the day?
|
This slide introduces the concept of using graphs to visualize data, specifically temperature data in the context of weather and climate studies. Start by explaining the purpose of a graph and how it can help us understand information better. Demonstrate how to create a line graph, emphasizing the importance of plotting points accurately. Each point on the graph will represent the temperature at a specific time of day, which the students will plot using the data they’ve collected. Encourage the students to look for and discuss patterns they observe in the graph, such as daily temperature changes. This activity will help them understand how to interpret data and draw conclusions from graphical representations.
Class Activity: Temperature Hunt
– Measure temperature outdoors
– Record temperatures in various locations
– Note the temperature in the shade vs. in the sun, near buildings, and on the grass
– Work in pairs to collect data
– Fill in your data log sheet
– Use the data log sheet to record your findings accurately
|
This activity is designed to engage students with hands-on experience in collecting temperature data, which is a key aspect of understanding weather and climate. Students should be instructed on how to use thermometers and record data accurately. Provide each pair with a data log sheet to fill in the temperatures they measure. Emphasize the importance of measuring in different locations to see how temperature can vary. After the activity, guide students to graph their findings and discuss the results as a class. Possible variations of the activity could include measuring at different times of the day or comparing with temperatures from other days or locations.
Creating Our Temperature Graphs
– Share your temperature findings
– Draw a line graph with your data
– Use graph paper to plot temperature vs. time
– Label the graph’s axes properly
– X-axis: time of day, Y-axis: temperature in degrees
– Understand the temperature trends
– Look for patterns in temperature changes over time
|
After collecting temperature data, students will return to the classroom to share their findings with the class. This collaborative approach allows students to compare data and understand variations in temperature at different locations. They will then use graph paper to draw a line graph, carefully plotting the temperature data against the time of day. It’s crucial to guide them in labeling the X-axis with the time of day and the Y-axis with temperature measurements. Discuss with the students how to determine the scale for their graph to ensure accuracy. Finally, analyze the completed graphs as a class to identify any temperature trends and discuss what factors might affect these patterns. This activity will help students understand how to visualize data and the importance of accurate graphing in scientific studies.
Conclusion: Understanding Temperature Data
– Reviewing temperature measurement
– We use thermometers to measure how hot or cold it is.
– Observing temperature patterns
– Did the temperature rise in the afternoon? Was it cooler in the morning?
– Learning from our temperature graphs
– Our graphs show us daily and seasonal changes in temperature.
– Importance of temperature in weather
– Temperature helps us describe and predict weather patterns.
|
In this concluding slide, we recap the process of measuring temperature and its significance in understanding weather and climate. Emphasize the use of thermometers and the units of measurement. Discuss the temperature patterns observed by the students during the data collection phase, such as daily highs and lows. Highlight how the temperature graphs can illustrate trends and changes over time, providing insights into weather patterns and seasonal shifts. Explain that by analyzing temperature data, we can make predictions about future weather conditions. Encourage students to think about how temperature affects their daily lives and the environment.
Homework: Temperature Tracking & Graphing
– Track temperature for a week
– Record data on your worksheet
Use the worksheet to note daily temperatures
– Create a graph from your data
Use a bar or line graph to show temperature changes
– Present your graph next class
|
This homework assignment is designed to give students hands-on experience with collecting data and representing it visually through graphing. Students should record the temperature at the same time each day to maintain consistency. They can use a thermometer at home or check a reliable weather website. After collecting data for a week, they will use the worksheet to create a graph, which could be a bar or line graph, to illustrate the temperature fluctuations over the week. Encourage creativity in their graph presentation. In the next class, students will present their findings, which will help them practice speaking skills and reinforce their understanding of temperature changes.


