


Use Data To Describe Climates
Subject: Science
Grade: Fourth grade
Topic: Weather And Climate
Please LOG IN to download the presentation. Access is available to registered users only.
View More Content

Understanding Weather and Climate
– Daily weather discussions
– How we describe today’s weather
– Defining climate
– Climate: average weather over time
– Weather vs. Climate
– Weather is day-to-day, climate is long term
– Climate data usage
|
This slide introduces the concepts of weather and climate to fourth-grade students. Begin by discussing how we talk about weather in our daily lives, such as describing if it’s sunny, rainy, or windy today. Then, define climate as the average weather conditions in a place over a long period, typically 30 years. Highlight the difference between weather and climate by explaining that weather changes day-to-day, but climate is the general pattern of weather over time. Encourage students to think about the types of data that might be used to describe a climate, such as temperature averages, rainfall, and seasonal changes. Use examples relevant to the students’ local area to make the information more relatable.
Understanding Weather
– What is weather?
– Weather is the day-to-day state of the atmosphere.
– Examples of weather conditions
– Conditions include sunny, rainy, windy, and snowy.
– Weather’s changing nature
– Weather can change quickly, affecting our daily plans.
– Observing daily weather changes
|
This slide introduces the concept of weather as part of the larger topic of climates. Weather is described as the short-term conditions of the atmosphere that we experience daily. Examples help students relate to the types of weather they observe, such as sunshine or rain. Emphasize the variable nature of weather, how it can change within minutes or over a day, and encourage students to share their own observations of weather changes. This sets the foundation for understanding how weather data can be collected and used to describe different climates.
Understanding Climate
– Climate vs. Weather
– Climate is the long-term average of weather patterns.
– Climate indicates typical weather
– It helps predict what weather to expect in different regions.
– Various climates around the globe
– Climates range from hot and humid to cold and icy.
– Examples: Tropical, Desert, Polar
– Tropical climates are warm, deserts are dry, polar areas are cold.
|
This slide introduces the concept of climate and how it differs from daily weather. It’s important to convey that climate is a long-term view of weather patterns in a particular region, which can help us predict what kind of weather is typical there. Discuss the different types of climates found around the world, such as tropical, desert, and polar, and provide examples of each to help students visualize and understand these concepts. Encourage students to think about the climate they live in and how it compares to other climates around the world.
Data and Climate: Understanding Weather Patterns
– Scientists study weather for climate insights
– Weather data over time helps define a region’s climate
– Temperature and rainfall are key data
– These elements help predict weather patterns and climate changes
– Methods of collecting weather data
– Using tools like thermometers and rain gauges
– Importance of data in climate study
|
In this slide, we aim to explain how scientists use weather data to understand the broader concept of climate. Emphasize that climate is the average weather in a place over many years. Temperature and rainfall are crucial because they are the most common variables that affect a region’s climate. Discuss the tools scientists use, such as thermometers for temperature and rain gauges for rainfall. Explain that by collecting this data consistently, scientists can make predictions about future weather patterns and climate changes. Encourage students to think about the climate in their own region and what kind of weather data might be important to collect.
Reading Climate Graphs
– Understanding climate graphs
– Shows weather patterns over time
– Learning to read a climate graph
– We’ll explore the parts of a climate graph
– Identifying temperature patterns
– Look for the line showing temperature changes
– Recognizing rainfall patterns
– Find the bars that represent monthly rainfall
|
This slide introduces students to the concept of climate graphs, which are essential tools for visualizing long-term weather patterns such as temperature and precipitation. Begin by explaining what a climate graph is and its importance in understanding climate. Then, guide students on how to interpret the different components of a climate graph, with a focus on identifying patterns in temperature and rainfall. Use examples of climate graphs to illustrate how temperature is typically represented by a line graph, while rainfall is shown using bar graphs. Encourage students to observe how the two elements interact over the course of a year and what this tells us about the climate of a region.
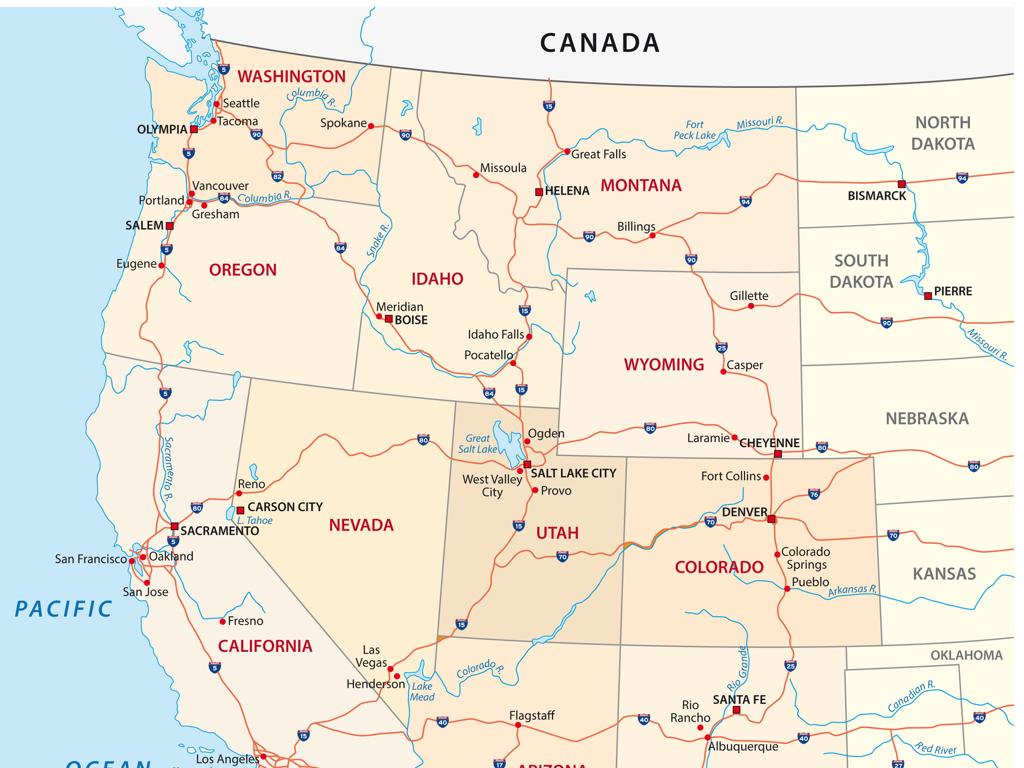
Comparing Climates: NYC vs LA
– How to compare different climates?
– Analyze climate graphs for NYC & LA
– Graphs show average monthly temperature and rainfall
– Observe temperature variations
– NYC has cold winters and hot summers, LA is milder
– Examine differences in rainfall
– NYC has more even rainfall, while LA has a dry season
|
This slide aims to teach students how to compare climates by using data. Start by explaining that climate graphs can help us visualize and compare the average weather conditions of different places over time. Show them the climate graphs for New York City and Los Angeles, pointing out the differences in temperature and rainfall throughout the year. For example, New York City experiences a wide range of temperatures with distinct seasons, whereas Los Angeles has a more consistent, milder climate. Rainfall patterns also differ, with New York having fairly consistent precipitation throughout the year and Los Angeles having a dry season. Encourage students to think about how these climate differences might affect the way people live in these cities.
Activity: Create Your Climate Graph
– Become a climate scientist!
– Craft your climate graph using data
– Use the temperature and precipitation data provided
– Share your graph with the class
– Describe the climate your graph shows
– Explain what the data tells us about the climate
|
In this activity, students will apply their knowledge of climates by creating their own climate graphs using provided data sets. This hands-on experience reinforces their understanding of how temperature and precipitation data shape a region’s climate. Provide students with data on monthly temperatures and rainfall. Guide them on plotting this data on a graph, with temperature on one axis and precipitation on the other. Once completed, students will present their graphs to the class, explaining what the data suggests about the climate of the region (e.g., tropical, desert, temperate). For teachers: Prepare diverse data sets to cover different climate types, ensure students understand how to read the data and create graphs, and facilitate a discussion on how different climates affect the environment and life in those regions.
Class Activity: Weather Reporter
– Form groups to report on climates
– Analyze climate data for a week
– Look at temperature, precipitation, and wind patterns
– Create a weekly weather report
– Include daily forecasts and any expected changes
– Present your report to the class
|
This interactive group activity is designed to teach students about different climates by having them act as weather reporters. Divide the class into small groups and assign each group a different climate zone. Provide them with data on temperature, precipitation, and wind for a week in their assigned climate. Students will analyze this data to create a weather report, as if they were real meteorologists. Encourage them to use creative presentation methods, such as props or visual aids, to make their report engaging. Possible activities: 1) Comparing climate data between groups, 2) Discussing how climate affects daily life, 3) Exploring extreme weather events, 4) Creating a weather forecast skit, 5) Designing weather report graphics.
